Track and measure seo success with seo kpis – Track and measure success with KPIs is crucial for any website aiming to improve its online visibility and attract more organic traffic. This guide will walk you through defining key performance indicators (KPIs), tracking performance using various tools, measuring the impact of efforts, analyzing data, reporting on success, optimizing strategies, and examining real-world case studies. We’ll also explore illustrative examples to make the process more tangible and actionable.
Understanding how to effectively track and measure success allows you to gain valuable insights into your website’s performance and identify areas needing improvement. This process is essential for demonstrating the return on investment (ROI) of your initiatives and for making data-driven decisions to optimize your strategy.
Defining Success Metrics
Defining success isn’t about just increasing website traffic. It’s about aligning website improvements with tangible business goals. This involves understanding which metrics truly matter and how to measure them effectively. Success is demonstrably tied to measurable improvements in key areas like lead generation, conversions, and revenue.Measuring success requires a deep dive into quantifiable metrics that reflect the effectiveness of your strategies.
Choosing the right metrics and understanding their significance is critical for demonstrating the value of your efforts to stakeholders and optimizing your approach for future success. A strong understanding of how various KPIs connect to business objectives is crucial for a robust strategy.
Quantifiable Performance Metrics
Understanding the various quantifiable metrics that contribute to overall success is vital for making informed decisions and demonstrating the return on investment (ROI) of initiatives. These metrics provide a clear picture of the performance of your website and the effectiveness of your strategies.
- Organic Traffic: This measures the number of visitors coming to your website from search engine results pages (SERPs) without paying for advertising. Organic traffic is a critical indicator of effectiveness. High organic traffic often translates to increased brand visibility and potential customer acquisition.
- Rankings: This tracks the position of your website for specific s in search engine results. Tracking rankings helps assess the visibility of your website for relevant searches.
- Click-Through Rate (CTR): CTR measures the percentage of users who click on your website link from a search engine result. High CTR indicates that your website’s title tag and meta description are effectively attracting users.
- Conversion Rate: This measures the percentage of website visitors who complete a desired action, such as making a purchase or filling out a form. A high conversion rate signifies the effectiveness of your website in driving desired outcomes.
- Bounce Rate: This metric reflects the percentage of visitors who leave your website after viewing only one page. A high bounce rate might indicate issues with website content, design, or user experience. Lower bounce rates are often linked to engaging content and a user-friendly website.
- Time on Site: This measures the average duration visitors spend on your website. Higher time on site suggests that visitors find your content valuable and engaging.
- Pages per Session: This KPI measures the average number of pages a visitor views during a session. More pages per session suggest that your website effectively guides visitors through relevant content.
- Lead Generation: This reflects the number of qualified leads generated through efforts. It’s directly tied to the effectiveness of strategies in attracting prospects.
- Revenue Generated: This is the ultimate measure of success. It directly reflects the financial impact of efforts on the business.
Relationship to Business Objectives
Effective strategies are directly tied to specific business objectives. These metrics demonstrate how initiatives contribute to overall business goals. The link between metrics and business objectives should be clearly defined to justify investments and measure ROI effectively.
- Increased Brand Awareness: Higher organic traffic and improved rankings contribute to increased brand visibility.
- Enhanced Lead Generation: Effective attracts qualified leads, contributing to business growth.
- Improved Conversion Rates: Optimizing website content and structure for user experience improves conversion rates.
- Higher Revenue: All the above contribute to increased revenue through effective lead generation and sales conversions.
KPIs and Data Sources
A well-structured table helps organize KPIs and their corresponding data sources. This allows for consistent tracking and analysis of performance.
Tracking and measuring SEO success with key performance indicators (KPIs) is crucial. Understanding how visible experts achieve rapid growth in their fields, like in how visible experts get on the fast track , can provide valuable insights. Ultimately, mastering SEO KPIs is key to boosting your online visibility and achieving those desired results.
| KPI | Data Source |
|---|---|
| Organic Traffic | Google Analytics, Search Console |
| Rankings | SEMrush, Ahrefs, Rank Tracker |
| Click-Through Rate (CTR) | Google Analytics, Search Console |
| Conversion Rate | Google Analytics, CRM Systems |
| Bounce Rate | Google Analytics |
| Time on Site | Google Analytics |
| Pages per Session | Google Analytics |
| Lead Generation | CRM Systems, Marketing Automation Platforms |
| Revenue Generated | Sales Data, CRM Systems |
Selecting Relevant KPIs, Track and measure seo success with seo kpis
Selecting the most relevant KPIs depends heavily on your specific business objectives. Understanding your goals and analyzing your target audience are key to selecting the right KPIs for your website.
- Business Goals: Align KPIs with your overall business objectives (e.g., lead generation, brand awareness, revenue). This is critical for demonstrating the value of efforts.
- Target Audience: Identify the demographics and search behaviors of your target audience. This helps in selecting the right s and metrics to track.
- Industry Trends: Consider industry benchmarks and best practices for selecting and evaluating KPIs. Benchmarking against competitors helps identify areas for improvement.
Tracking Performance
Knowing your performance is crucial for continuous improvement. Tracking your efforts isn’t just about checking a box; it’s about understanding what’s working, what’s not, and how to optimize your strategy for better results. This involves diligently monitoring key metrics, analyzing user behavior, and consistently refining your approach. Regularly evaluating your performance helps you stay ahead of the curve in a dynamic online landscape.A crucial component of successful is the ability to track and measure your progress.
This involves collecting data on your chosen metrics, understanding user behavior, and continuously refining your approach. By meticulously tracking your performance, you gain invaluable insights into what’s working and what needs adjustment. This data-driven approach empowers you to optimize your strategy, ensuring your website is visible and accessible to your target audience.
Collecting Data on Metrics
To effectively track performance, you need to gather data on the metrics you’ve identified as crucial. This data collection process forms the foundation for evaluating your strategies. Tools and platforms are essential for efficiently collecting and analyzing this data. Accurate data collection ensures your strategies remain aligned with your goals and are adaptable to changes in the online environment.
Tools for Monitoring Website Traffic and User Behavior
Numerous tools and platforms are available to track website traffic and user behavior. These tools provide insights into how users interact with your website, enabling you to optimize your strategy for better performance. Understanding user behavior is paramount for improving website experience and driving conversions.
- Google Analytics: A free, comprehensive platform offering extensive data on website traffic, user behavior, and conversion rates. It provides detailed insights into user demographics, location, and device usage. This rich data set is invaluable for understanding user interactions and tailoring your content and site structure for better engagement.
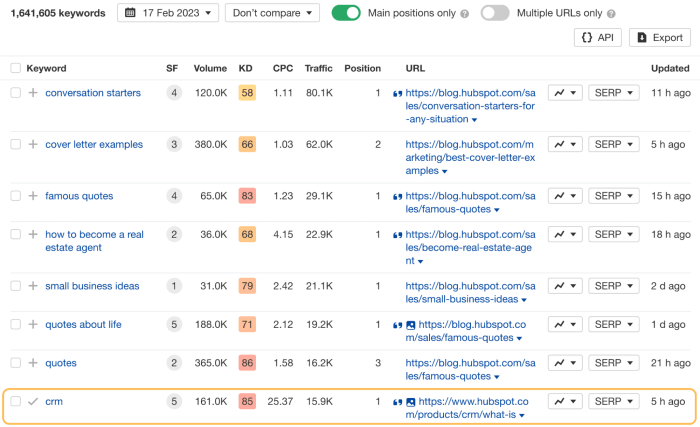
- SEMrush: A robust tool that tracks rankings, competitor analysis, and backlink profiles. SEMrush provides a comprehensive view of your performance, enabling you to identify opportunities for improvement and track the impact of your strategies. It offers data-driven insights into performance, competitor analysis, and link building.
- Ahrefs: A powerful platform for website analysis, providing comprehensive data on backlinks, rankings, and site audits. Ahrefs offers a vast database of backlinks, allowing you to identify potential opportunities and track the effectiveness of your link-building strategies. This tool also facilitates competitor analysis and research.
- Moz Pro: A comprehensive tool providing research, rank tracking, and site audits. Moz Pro offers a variety of features to optimize your website and improve your performance. It supports both on-page and off-page activities and offers a suite of tools for research and ranking tracking.
Comparing Tracking Tools
Choosing the right tracking tool depends on your specific needs and budget. The following table compares various tools based on features and pricing:
| Tool | Key Features | Pricing |
|---|---|---|
| Google Analytics | Website traffic, user behavior, conversion rates, demographics, device usage | Free |
| SEMrush | rankings, competitor analysis, backlink profiles, audits | Paid (starting at a few hundred dollars per month) |
| Ahrefs | Backlinks, rankings, site audits, competitor analysis, content explorer | Paid (starting at a few hundred dollars per month) |
| Moz Pro | research, rank tracking, site audits, on-page optimization tools | Paid (starting at a few hundred dollars per month) |
Establishing Baselines for Performance Metrics
Establishing baselines for performance metrics is crucial for assessing the effectiveness of your strategies. A baseline provides a point of reference for measuring progress and identifying areas for improvement. Without a baseline, it’s difficult to gauge the true impact of your efforts. By setting baselines, you can track your progress over time and see the results of your initiatives.
A baseline provides a critical benchmark against which future performance can be measured.
Measuring Impact
Understanding the impact of your efforts goes beyond simply tracking rankings. It’s about demonstrating how these efforts translate into tangible business results. This crucial step requires a systematic approach to attribute improvements in website traffic to specific activities and correlate those activities with overall business outcomes. Ultimately, the goal is to quantify the return on investment (ROI) of your initiatives.Successfully measuring impact requires a multifaceted approach, moving beyond vanity metrics like rankings to understand the deeper connection between your strategies and business objectives.
This involves careful analysis of data from various sources, understanding the nuances of attribution modeling, and using a structured framework for calculating ROI.
Key Factors Influencing Success
Several factors play a crucial role in determining the success of an strategy. These include the quality and relevance of website content, the authority of the website’s backlinks, the technical aspects of website structure, and the ongoing adaptation to evolving search engine algorithms. Each of these factors contributes to a holistic strategy.
Tracking and measuring SEO success with KPIs is crucial, but equally important is understanding how to define and achieve your social media goals. This often involves a bit of trial and error, which is why I highly recommend checking out this helpful guide on setting up social media goals and how to hit them a guide to setting up social media goals and how to hit them.
Ultimately, a strong social media presence can boost your SEO efforts and give you a more complete picture of your overall online performance, making it easier to track and measure SEO success with those all-important KPIs.
- Content Quality and Relevance: High-quality, engaging content that directly addresses user needs is paramount for attracting and retaining visitors. This involves conducting thorough research to identify relevant search queries and then producing valuable content that answers those queries effectively. Examples include blog posts, articles, and product descriptions that are comprehensive, well-written, and optimized for search engines.
- Backlink Authority: The number and quality of backlinks pointing to your website are crucial indicators of its authority and trustworthiness in the eyes of search engines. High-quality backlinks from reputable websites demonstrate that your content is valuable and relevant to a wider audience. Earned backlinks from reputable sources, rather than paid links, are generally more effective in boosting rankings and increasing trust.
- Technical Website Structure: A well-structured website with fast loading times and mobile-friendliness is essential for a positive user experience and search engine crawlability. Search engines prioritize websites that offer a seamless experience, reflecting this through rankings and traffic metrics.
- Algorithm Adaptation: Search engine algorithms are constantly evolving. Staying abreast of these changes and adapting your strategies accordingly is critical to maintaining optimal performance. Regular monitoring of algorithm updates and adjustments to your strategy are necessary for long-term success.
Attributing Website Traffic Improvements
Accurately attributing website traffic improvements to specific activities is vital for understanding the effectiveness of different strategies. A variety of tools and methods can help you achieve this.
- Attribution Modeling: Utilizing tools that track user journeys and identify touchpoints, such as Google Analytics, can help to understand how various efforts influence website traffic. This method is crucial to determine which activities have the most significant impact on conversions.
- Tracking s and Phrases: Monitoring the performance of specific s and phrases you’ve targeted is a crucial element in tracking the impact of activities. This involves examining changes in search engine rankings and traffic volume for these specific terms. The correlation between rankings and website traffic is a key metric in effectiveness.
- Comparing Metrics Before and After Implementation: Tracking key metrics like organic traffic, rankings, and bounce rate before and after implementing specific activities provides a clear picture of the impact of those changes. This comparison allows you to evaluate the performance of each strategy in isolation and in combination with others.
Analyzing Correlation Between Efforts and Business Outcomes
Understanding the correlation between efforts and business outcomes requires a holistic view of the data. It involves understanding how activities translate into conversions and ultimately impact revenue generation.
- Conversion Tracking: Implementing robust conversion tracking within your website analytics platform is crucial for understanding the direct impact of efforts on conversions. Tracking website interactions such as form submissions, purchases, or sign-ups can help you quantify the results of efforts in relation to business objectives.
- Sales Data Analysis: Analyzing sales data in conjunction with data provides a comprehensive understanding of the impact of activities on revenue generation. Comparing sales figures with periods of increased activity and identifying patterns is essential.
- Customer Journey Mapping: Understanding the customer journey from initial search to final conversion is crucial to understanding how impacts the entire sales process. This understanding allows for targeted strategies that support the specific stages of the customer journey.
Measuring the ROI of Initiatives
Quantifying the return on investment of initiatives involves a structured approach, considering the costs associated with activities and the revenue generated as a result.
- Cost Analysis: Identifying and documenting the costs associated with each activity, including tools, personnel, and time, is a crucial element of measuring ROI. Understanding the cost structure of projects is critical for calculating return on investment.
- Calculating Revenue Generated: Linking -driven traffic to revenue generated is crucial. This requires precise tracking of sales and conversions attributed to specific activities. The calculation of revenue generated through initiatives is an essential component of calculating the ROI.
- ROI Formula: A common formula for calculating ROI is (Revenue Generated – Costs) / Costs. This provides a clear representation of the profitability of initiatives.
Analyzing Data: Track And Measure Seo Success With Seo Kpis
Now that you’ve got a handle on tracking your performance with key performance indicators (KPIs), it’s time to dig deeper and analyze the data. This crucial step reveals patterns, identifies areas for improvement, and ultimately leads to a more effective strategy. Understanding the “why” behind the numbers is as important as seeing the numbers themselves.
Organizing Data into Meaningful Reports
Raw data from tools is like a jumbled pile of puzzle pieces. To truly understand the impact of your efforts, you need to organize this data into comprehensive reports. These reports should clearly show key metrics over time, allowing you to quickly identify trends and patterns. Effective reports provide a concise overview of your performance, highlighting both successes and areas needing attention.
Examples of Reports
Here are some examples of reports that can be incredibly valuable for understanding your website’s performance. These reports should be tailored to your specific needs and goals.
| Report Type | Key Metrics | Purpose |
|---|---|---|
| Website Traffic Report | Organic traffic, bounce rate, average session duration, pages per session | Understand how many users are visiting your site organically, how engaged they are, and how long they stay. |
| Performance Report | rankings, search volume, click-through rate (CTR) | Identify which s are performing well, which need improvement, and how they contribute to overall traffic. |
| Backlink Report | Number of backlinks, referring domains, anchor text analysis | Assess the quality and quantity of backlinks pointing to your site. A strong backlink profile often indicates higher search engine rankings. |
| Technical Report | Mobile-friendliness, site speed, crawl errors, indexation issues | Identify technical problems that might be hindering search engine crawlers from accessing and indexing your site. |
Interpreting Patterns and Trends in Data
Analyzing data isn’t just about looking at numbers; it’s about spotting trends and patterns. Are your organic traffic numbers consistently increasing, or are there fluctuations? Are certain s performing better than others? Understanding these trends is key to adapting your strategy over time. Look for correlations between changes in specific metrics and your actions, such as a recent content update or link-building campaign.
By examining these correlations, you can refine your approach for even better results.
Identifying Areas Needing Improvement in Strategy
Data analysis helps uncover areas where your strategy could be enhanced. If organic traffic is stagnant or declining, investigate the underlying reasons. Is there a sudden drop in rankings for specific s? Have your competitors improved their efforts? Identifying these weaknesses allows you to make strategic adjustments and fine-tune your approach to achieve better results.
By addressing these shortcomings proactively, you’ll be able to sustain and enhance your performance.
Reporting on Success
Communicating performance effectively to stakeholders is crucial for gaining buy-in and securing budget for future initiatives. A well-structured report clearly outlining key achievements, challenges, and actionable insights fosters transparency and demonstrates the value of efforts. This section will detail various formats for reporting performance and highlight how to present data effectively to stakeholders.A comprehensive report should not only present data but also interpret it to showcase the impact of strategies.
It should connect the dots between actions and their corresponding outcomes, allowing stakeholders to understand the tangible value generated. Clear and concise reporting helps secure continued support and resource allocation for initiatives.
Reporting Formats for Performance
Different stakeholders require varying levels of detail and understanding. Therefore, tailoring the reporting format is essential for effective communication. Presenting data in a visually appealing and digestible format is key. Dashboards, infographics, and presentations are all viable options, each with its own strengths.
Dashboard Reporting
Dashboards are highly interactive tools for tracking performance in real-time. They allow stakeholders to monitor key metrics like organic traffic, rankings, and conversion rates. Visualizations like charts and graphs make complex data easily digestible, enabling quick identification of trends and patterns. Real-time updates empower stakeholders to address issues proactively. Example: A dashboard could display a graph of organic traffic growth over time, alongside a table showing top-ranking s and their corresponding positions.
Infographic Reporting
Infographics are effective for summarizing complex data in a visually appealing manner. They condense key metrics and insights into easily understandable visuals. Infographics are particularly valuable for presenting high-level summaries of performance to a broader audience. Example: An infographic could visually represent the correlation between content creation and organic traffic, using charts and icons to highlight the positive relationship.
This format excels at quickly conveying key takeaways.
Presentation Reporting
Presentations are ideal for in-depth discussions and strategic planning sessions. They provide a platform for detailed analysis of performance, highlighting key findings, and presenting actionable insights. Presentations are crucial for justifying budget requests, explaining strategies, and obtaining buy-in from senior management. Example: A presentation could present a detailed analysis of a particular campaign, including performance, website traffic, and conversion rates.
It would include a section highlighting actionable insights and recommendations for improvement.
Highlighting Key Findings and Actionable Insights
Clearly identifying key findings and actionable insights is crucial for driving informed decision-making. These reports should highlight areas of success, identify challenges, and propose solutions. Recommendations should be specific and actionable, providing a clear path for future improvements. Quantify results whenever possible. Example: “Increased organic traffic by 25% in Q3 due to the implementation of the new content strategy.
Tracking and measuring SEO success with KPIs is crucial, but understanding the inner workings of search engine algorithms is equally important. Google’s search engine is constantly evolving, and factors like AI are reshaping how we optimize. To truly grasp this, delve into the fascinating exploration of inside the world of google how SEO and AI shape search.
This knowledge directly informs our choices in selecting and monitoring relevant KPIs for our SEO strategies.
Actionable insights: Continue to invest in high-quality content creation focused on long-tail s.”
Optimizing Strategies
Fine-tuning your strategy isn’t a one-time fix; it’s an ongoing process of adaptation and refinement. Success hinges on consistently analyzing performance data, recognizing emerging trends, and adjusting your tactics to maintain a competitive edge. This involves a deep dive into various strategies, identifying their impact on key performance indicators, and iterating based on the insights gained.Effective optimization involves understanding how different strategies affect your chosen metrics.
This understanding allows for data-driven adjustments to your approach, leading to better results. A flexible and adaptive strategy is crucial for long-term success.
Comparing Different Strategies
Different strategies yield varying results depending on the specific context and goals. Analyzing the impact of each strategy on your chosen KPIs is vital for optimizing performance. For example, technical improvements can enhance site crawlability and indexing, leading to higher organic visibility. Content optimization, on the other hand, focuses on enhancing user experience and creating valuable content that attracts and retains a target audience.
Refining Strategies Based on Performance Data
Regularly monitoring and analyzing performance data is essential for strategy refinement. This involves identifying areas for improvement and making data-driven adjustments to your approach. For instance, if your rankings for specific terms are declining, you might need to review the content on those pages to ensure relevance and quality. Tools like Google Analytics and Search Console can offer valuable insights into user behavior, click-through rates, and bounce rates, allowing for targeted adjustments.
Adapting to Emerging Trends and Best Practices
best practices and emerging trends are constantly evolving. Staying informed and adaptable to these changes is critical for maintaining a competitive edge. For example, the rise of mobile-first indexing emphasizes the importance of a responsive website design. Keeping abreast of algorithm updates and adopting new techniques like schema markup can significantly improve your search visibility.
Optimizing Strategies for Better Results
Examples of optimizing strategies include:
- Content Optimization: Regularly updating and improving existing content based on user engagement and performance is vital. Incorporating high-quality images, videos, and other multimedia elements can enhance user experience and attract more traffic.
- Link Building: Building high-quality backlinks from authoritative websites can boost your website’s credibility and improve search engine rankings. Focus on earning natural backlinks rather than employing spammy tactics. Guest posting on relevant blogs and participating in industry forums can generate valuable backlinks.
- Technical : Ensuring your website is technically sound is crucial. Improving site speed, optimizing site structure, and implementing structured data markup can improve your search engine visibility. Tools like Google PageSpeed Insights can identify areas for improvement in website speed and performance.
Case Studies
Unveiling the power of lies not just in theory, but in practical application. Real-world case studies demonstrate how strategies, meticulously crafted and implemented, can drive tangible results for businesses. These examples highlight the impact of adapting to specific industry contexts and market demands, ultimately showcasing how data-driven decisions lead to significant improvements in online visibility and revenue.Successful campaigns aren’t one-size-fits-all.
Each business, website, and industry presents unique challenges and opportunities. Analyzing successful implementations provides invaluable insights into how to tailor strategies for optimal results. By examining the specific tools, processes, and metrics used in these campaigns, we can gain a deeper understanding of how can significantly enhance a business’s online presence and profitability.
A Retail Clothing Brand’s Triumph
This case study focuses on a retail clothing brand aiming to expand its online reach and drive sales. The initial audit revealed significant opportunities for improvement in targeting, content optimization, and technical site issues. The team implemented a multi-faceted approach, using tools like SEMrush and Ahrefs for research and competitor analysis.The strategy prioritized creating high-quality, informative product descriptions and blog posts tailored to the target audience.
This content focused on specific styles, trends, and customer needs, leading to a substantial increase in organic traffic. The team also optimized the website’s technical aspects, improving page load times and mobile responsiveness. By using Google Analytics and Search Console, they tracked key performance indicators (KPIs) such as organic traffic, bounce rate, and conversion rates. They meticulously analyzed these metrics to identify areas for improvement and fine-tuned their strategies accordingly.The result was a remarkable increase in organic search traffic, which directly translated into a 35% rise in online sales within six months.
This outcome underscores the importance of consistent effort, adaptation, and meticulous data analysis to achieve significant success.
A Local Restaurant’s Online Visibility Boost
A local restaurant, seeking to attract more customers through online orders and dine-in reservations, implemented a targeted strategy focused on local search optimization. The restaurant’s website was optimized for local s, ensuring it appeared prominently in local search results. They utilized Google My Business, a free tool, to enhance their online presence and attract customers in the immediate vicinity.The restaurant actively encouraged online reviews, responding to feedback and building a positive reputation.
They also incorporated location-specific content on their website, including menus and special offers for nearby neighborhoods. This targeted approach yielded a 20% increase in online orders and a 15% rise in dine-in reservations.The case demonstrates how a data-driven, location-centric strategy can positively impact local businesses.
Adapting Strategies for Specific Contexts
The examples above highlight the necessity of adapting strategies to specific contexts. A retail clothing brand requires a different approach compared to a local restaurant. Tailoring strategies to the unique needs of each business ensures effectiveness and efficiency. Analyzing market trends and competitor activities are crucial for creating successful strategies.The success of initiatives hinges on understanding the target audience and their online behavior.
This understanding guides the creation of relevant and engaging content, crucial for attracting organic traffic and driving conversions. Regular monitoring, analysis, and adjustments based on performance data are vital to optimizing campaigns for continued success.
Illustrative Examples
Understanding success goes beyond abstract concepts. Real-world examples demonstrate how key performance indicators (KPIs) translate into tangible results and actionable strategies. These examples showcase the practical application of principles and provide a clear picture of how to track, analyze, and report on performance effectively.The following sections provide illustrative examples of comprehensive performance reports, key metrics, visually appealing dashboards, and stakeholder communication methods.
These examples use hypothetical but realistic data to highlight best practices and demonstrate the power of data-driven decision-making in .
Comprehensive Performance Report Example
A comprehensive performance report should provide a detailed overview of the website’s performance over a specific time period. It should cover key areas like organic traffic, rankings, backlinks, and user engagement metrics. The report should also include actionable insights and recommendations based on the analysis. A well-structured report allows stakeholders to easily grasp the overall performance and understand the impact of efforts.
- Metrics Covered: Organic traffic, rankings (top 10, top 5, and exact match rankings), domain authority, backlink profile (number of backlinks, referring domains), bounce rate, time on site, pages per visit, conversion rate.
- Time Period: Quarterly or monthly reports are common. Reports should clearly define the start and end dates of the analyzed period.
- Data Presentation: Charts and graphs are essential for visualizing trends and patterns in the data. Key performance indicators should be presented in a clear and concise manner.
- Actionable Insights: Identify areas for improvement. For example, if organic traffic is declining, the report should suggest potential causes and strategies to rectify the issue.
Key Metrics Table Example
This table demonstrates a sample of key metrics and their values over time for a hypothetical website.
| Metric | 2023-Q1 | 2023-Q2 | 2023-Q3 |
|---|---|---|---|
| Organic Sessions | 10,000 | 12,500 | 15,000 |
| Average Position ( X) | 7 | 5 | 3 |
| Backlinks | 200 | 250 | 300 |
| Bounce Rate | 45% | 40% | 35% |
| Time on Site (Avg.) | 2:30 | 3:00 | 3:30 |
Visual Dashboard Example
A visually appealing dashboard is crucial for quickly grasping key performance indicators. The dashboard should present data in an easily digestible format, using charts and graphs.
- Key Metrics Display: Organic traffic, rankings, and conversion rates.
- Visual Representation: Use line graphs to show trends over time, bar graphs to compare metrics across different s, and pie charts to illustrate the percentage distribution of traffic sources.
- Interactive Elements: Allow users to filter data by date range, , or other criteria.
- Color Coding: Use color coding to highlight key metrics and trends (e.g., green for positive changes, red for negative changes).
Stakeholder Communication Method
Communicating findings effectively is essential. Visual aids and clear language make the data understandable for non-technical stakeholders.
- Visual Aids: Use charts, graphs, and dashboards to present data in an accessible manner.
- Plain Language: Explain complex concepts using clear and concise language that everyone can understand.
- Key Performance Indicators: Focus on quantifiable results and how they impact business goals.
- Recommendations: Provide actionable recommendations based on the analysis. For instance, if a specific ranking is improving, suggest further optimizing content for similar s.
Last Point
In conclusion, tracking and measuring success with KPIs is a vital aspect of any effective digital marketing strategy. By consistently monitoring performance, analyzing data, and adapting your approach, you can optimize your website’s visibility and drive significant business growth. This guide has provided a comprehensive framework for doing just that, enabling you to achieve quantifiable results and demonstrate the true value of .