Top B2B website metrics to monitor using Google Analytics provides a roadmap for understanding your business website’s performance in the B2B sector. This comprehensive guide dives deep into crucial metrics, from traffic sources and user behavior to conversion rates, lead generation, and customer acquisition costs. We’ll explore how Google Analytics can be your powerful ally in tracking and improving these key performance indicators.
Understanding these metrics allows businesses to gain actionable insights, optimize strategies, and ultimately boost revenue. By analyzing website traffic patterns, conversion funnels, and user engagement, companies can identify areas for improvement and tailor their approach for maximum impact. This detailed guide will equip you with the knowledge and tools to leverage Google Analytics effectively.
Defining Key B2B Website Metrics
Understanding B2B website performance is crucial for success. It’s not just about attracting visitors; it’s about converting them into leads and ultimately, customers. Effective tracking and analysis of key metrics provide actionable insights into how your website is performing and where improvements can be made. These insights are critical for optimizing your B2B marketing strategy and aligning it with business goals.B2B website metrics differ significantly from B2C metrics.
B2B buyers often have more complex needs and decision-making processes, requiring a more targeted approach. Tracking the right metrics allows you to understand how your site is meeting those needs and ultimately driving conversions. Focusing on metrics like lead generation, sales cycle length, and customer lifetime value will help you refine your marketing efforts to resonate more deeply with your B2B audience.
Essential B2B Website Metrics
Effective B2B website performance relies on monitoring specific metrics. These metrics are essential for assessing the effectiveness of your website in attracting qualified leads and driving sales.
- Website Traffic: This encompasses the number of visitors, unique visitors, and page views. Understanding traffic patterns allows for analysis of popular content, identifying areas for improvement, and gauging the effectiveness of marketing campaigns. High traffic doesn’t automatically equate to high conversion rates. Traffic quality, measured by the source of the traffic and the engagement level of visitors, is critical for understanding how your website is performing.
- Lead Generation: B2B websites need to generate qualified leads who are actively interested in your products or services. This metric tracks the number of leads generated, the source of those leads, and the quality of those leads, which can be evaluated by their engagement with your website. Measuring conversion rates from visitors to leads provides insights into website effectiveness.
- Lead Conversion Rate: The conversion rate is a critical metric that indicates how well your website is converting leads into customers. It measures the percentage of leads who become customers. This metric is highly influenced by factors like the quality of your website content, the strength of your call-to-actions, and the overall user experience.
- Sales Cycle Length: Understanding the length of the sales cycle is vital for assessing how efficiently your website generates leads and converts them into customers. Analyzing this metric allows you to identify bottlenecks in the sales process and improve conversion efficiency. A shorter sales cycle often indicates a more effective website experience.
- Customer Lifetime Value (CLTV): This metric estimates the total revenue a customer is expected to generate throughout their relationship with your company. A higher CLTV indicates more valuable customers, which is often correlated with a higher-quality website experience that attracts those customers.
- Bounce Rate: This metric reflects the percentage of visitors who leave your website after viewing only one page. High bounce rates can indicate issues with website design, content relevance, or navigation. A high bounce rate might signal a need to optimize content and site structure for improved user engagement.
- Average Session Duration: This metric indicates the average time visitors spend on your website. A longer average session duration often suggests that the website content is engaging and relevant to the user’s needs. Analyzing this data can identify areas where user engagement can be improved.
- Pages Per Session: This metric tracks the number of pages a visitor views during a session. Higher numbers generally indicate more engaged users who are exploring different aspects of your website. Analyzing this data can help you understand the structure and relevance of your content.
Comparing B2B and B2C Website Metrics
The differences in website metrics between B2B and B2C contexts stem from variations in customer behavior and the sales cycle.
| Metric | B2B Website | B2C Website |
|---|---|---|
| Primary Goal | Lead generation, nurturing, and sales | Direct sales and customer acquisition |
| Customer Journey | Longer, more complex, involving multiple decision-makers | Shorter, often driven by impulse purchases |
| Content Focus | Detailed information, case studies, white papers | Product showcases, promotional content |
| Conversion Point | Lead form submissions, demos, consultations | Direct purchases, sign-ups |
| Key Metrics | Lead conversion rate, sales cycle length, CLTV, cost per lead | Conversion rate, average order value, customer acquisition cost |
Tracking Website Traffic and Engagement
Understanding website traffic and user engagement is crucial for B2B companies to gauge the effectiveness of their online presence and identify areas for improvement. This involves more than just counting visitors; it’s about understanding
- why* they’re visiting,
- what* they’re doing on the site, and ultimately,
- how* those actions translate into business outcomes. This deep dive into traffic and engagement metrics will provide actionable insights for optimization.
Analyzing user behavior and traffic sources is essential for B2B companies to tailor their marketing efforts. Tracking engagement with specific website elements, such as product pages or blog posts, provides insight into content effectiveness and user interest. By segmenting traffic, companies can identify high-value visitors, those most likely to convert, and focus resources accordingly.
Website Traffic Sources and User Behavior Metrics
Tracking website traffic sources is critical to understanding where your visitors are coming from. This includes not only the channels driving traffic (e.g., organic search, paid advertising, referrals) but also the specific s or campaigns generating interest. Understanding the origin of website traffic allows for informed adjustments to marketing strategies and budget allocation. Metrics like bounce rate, time on site, and pages per visit provide valuable insights into user behavior and engagement with the content.
Analyzing User Engagement with Specific Website Elements
To effectively measure engagement with specific website elements, track interactions like clicks, views, and downloads. Analyzing these actions on individual pages or sections of your website allows you to pinpoint which elements are most compelling to your target audience. This information can be used to optimize the design, content, and functionality of the website to improve user experience and engagement.
For instance, a high click-through rate on a specific product page suggests strong interest, while a high bounce rate from the same page might indicate a need for clearer information or a more compelling call to action.
Segmenting Website Traffic to Identify High-Value Visitors
Segmenting website traffic allows for a more granular understanding of your audience. By identifying high-value visitors, businesses can prioritize their marketing efforts and resources. These segments might include users who have downloaded specific resources, engaged with specific content, or have shown repeated visits to key pages. This targeted approach allows for more effective and efficient resource allocation. By focusing on these segments, businesses can ensure their marketing efforts are reaching the individuals most likely to convert.
Top 5 Traffic Sources and Associated Engagement Metrics
Understanding which traffic sources drive the most engaged users is crucial. The table below illustrates this, demonstrating how different channels contribute to user behavior and engagement.
| Traffic Source | Average Session Duration | Bounce Rate | Pages/Session | Conversion Rate |
|---|---|---|---|---|
| Organic Search | 4:30 | 25% | 4 | 2% |
| Paid Advertising | 3:15 | 28% | 3 | 1.5% |
| Social Media | 2:00 | 35% | 2 | 0.8% |
| Referral Traffic | 5:00 | 20% | 5 | 3% |
| Email Marketing | 6:00 | 18% | 3 | 4% |
This table provides a starting point for analysis. The specific values will vary depending on the industry, target audience, and the nature of the business. The key is to consistently monitor these metrics and adapt strategies based on the data.
Conversion Rate Optimization (CRO) Metrics
Conversion rate optimization (CRO) is a critical aspect of B2B website success. It focuses on improving the percentage of visitors who complete desired actions, like filling out a contact form or requesting a demo. By understanding and analyzing key metrics, B2B businesses can identify areas for improvement and ultimately drive more qualified leads and revenue.Understanding conversion rates, and the factors that influence them, is vital for achieving business goals.
This involves tracking key metrics, analyzing the data, and implementing strategies to improve the conversion process. By optimizing the user journey, businesses can increase the likelihood of turning website visitors into paying customers.
Crucial Metrics for Evaluating Conversion Rates
Conversion rates aren’t the only metric; other crucial metrics include the time spent on pages, bounce rate, and click-through rates. Tracking these metrics in tandem with conversion rates offers a comprehensive view of user behavior and website performance. These metrics provide insight into where users are getting stuck and where improvements can be made.
Conversion Points on a B2B Website
B2B websites have various conversion points, each requiring specific strategies for optimization. Lead generation, quote requests, and product demos are prime examples. A lead generation form, for instance, might require clear call-to-actions and concise form fields. Quote requests necessitate a straightforward and efficient process for users to submit their needs. Product demos need a clear and compelling explanation of the benefits and a seamless scheduling process.
Understanding the specific needs of each conversion point is key to optimizing conversions.
Factors Influencing B2B Conversion Rates
Several factors influence conversion rates on B2B websites. These include website design, navigation, content quality, and user experience (UX). A poorly designed website with confusing navigation can deter potential customers, leading to lower conversion rates. Content that doesn’t address the specific needs and pain points of the target audience will also hinder conversion. Ensuring a positive user experience, including mobile-friendliness, is crucial for driving conversions.
Steps to Improve Conversion Rates
Improving conversion rates involves a multi-faceted approach. This includes analyzing website data, identifying areas for improvement, implementing changes, and continuously monitoring and optimizing performance. Understanding the user journey is essential for optimizing the conversion process. Testing different approaches, such as A/B testing, can help pinpoint what works best. Iterative improvements are critical to achieving maximum conversion rates.
B2B Conversion Funnels and Key Metrics
Understanding the different conversion funnels and their specific metrics is crucial. A table outlining various B2B conversion funnels and their associated key metrics provides a structured approach to analyzing and improving performance.
Tracking website metrics like bounce rate and conversion rates in Google Analytics is crucial for B2B businesses. However, before diving deep into those metrics, it’s worth considering if social media marketing is actually a worthwhile investment for your service area business. For instance, is social media marketing goog for service area businesses ? Ultimately, analyzing these metrics will help you understand how well your website is performing and if your marketing efforts are paying off.
Understanding these website metrics is key to optimizing your B2B strategy.
| Conversion Funnel | Key Metrics |
|---|---|
| Lead Generation | Conversion rate, lead quality, form completion rate, time spent on landing pages, bounce rate |
| Quote Requests | Conversion rate, quote request volume, average quote value, response time |
| Product Demos | Demo request rate, demo completion rate, demo-to-sale conversion rate, demo scheduling time |
| Free Trials | Trial sign-up rate, trial completion rate, trial-to-paid conversion rate |
| Sales | Conversion rate, average deal size, sales cycle length |
Lead Generation and Qualification Metrics

Understanding your lead generation process is crucial for B2B success. This involves more than just collecting contact information; it requires a systematic approach to nurturing prospects and converting them into paying customers. Effective lead generation and qualification metrics provide valuable insights into the effectiveness of your strategies.Lead generation and qualification aren’t just about counting the number of leads; they’re about identifying theright* leads, those most likely to convert.
This requires a nuanced understanding of the process, from initial contact to final conversion. Effective metrics help you refine your approach, ensuring your efforts are targeted and productive.
Lead Generation Metrics
Understanding how many leads you’re generating is the first step. These metrics track the volume and source of leads, highlighting areas for improvement and opportunities for growth. Key metrics include:
- Number of leads generated: This is a fundamental metric, representing the raw number of potential customers who have expressed interest. Tracking this over time helps gauge the overall effectiveness of your marketing campaigns.
- Lead source: Identifying the channels that generate the most leads (e.g., website forms, webinars, email marketing) helps you optimize your marketing budget and focus on high-performing strategies. For example, if your LinkedIn campaigns are generating a disproportionate number of qualified leads, it’s a sign you should invest more in that platform.
- Lead generation cost per acquisition (CPL): This crucial metric calculates the average cost to acquire a new lead. By tracking CPL, you can assess the return on investment (ROI) of your marketing campaigns. A low CPL indicates that your lead generation campaigns are cost-effective.
- Conversion rate from website visits to leads: This metric measures the percentage of website visitors who convert into leads. A high conversion rate suggests a well-designed website that effectively captures visitor interest.
Lead Qualification Metrics, Top b2b website metrics to monitor using google analytics
Qualifying leads is essential to prioritize your efforts. It focuses on identifying those most likely to become paying customers.
Tracking top B2B website metrics using Google Analytics is crucial. Understanding bounce rates, time on site, and conversion rates helps optimize your site. But, to really boost those metrics, consider leveraging the power of best AI marketing tools. These tools can automate tasks like lead generation and personalized content, ultimately improving your website’s performance and leading to better conversions.
Ultimately, the right combination of data analysis and AI tools will help you fine-tune your B2B strategy.
- Lead qualification criteria: Establishing clear criteria for qualifying leads is crucial. These criteria should be specific to your target audience and align with your sales process. For instance, if you sell enterprise software, qualifying criteria might include the prospect’s budget, company size, and the complexity of their needs.
- Lead qualification rate: This metric measures the percentage of generated leads that meet your predefined qualification criteria. A high qualification rate indicates a well-defined and effective lead qualification process.
- Lead qualification time: Assessing how long it takes to qualify a lead provides insight into the efficiency of your qualification process. A shorter qualification time generally means a more efficient sales team.
- Lead score: A system that assigns numerical values to prospects based on pre-defined criteria, such as company size, budget, or job title. A higher score indicates a higher probability of conversion.
Lead Nurturing Metrics
Effective lead nurturing is a critical step in the sales cycle.
- Email open and click-through rates: These metrics help evaluate the effectiveness of your email campaigns in engaging prospects and driving them toward conversion.
- Website engagement metrics: These include time spent on pages, pages visited, and the frequency of visits. This provides insight into the degree of interest and engagement with your content.
- Lead nurturing response rate: This measures the percentage of nurtured leads that engage with your communications. A high response rate indicates effective content and engagement strategies.
- Conversion rate from nurtured leads to qualified leads: This crucial metric shows how effectively your nurturing efforts convert prospects into qualified leads. High conversion rates are a strong sign that your approach is working well.
Lead Scoring System Effectiveness Metrics
Lead scoring systems help prioritize leads and direct sales efforts.
- Lead conversion rate by score: This metric shows the conversion rate for leads in different score categories. This helps determine if the scoring system is effectively identifying high-potential leads.
- Lead qualification time by score: This metric shows the average time it takes to qualify leads with different scores. It helps identify if the lead scoring system is effective in prioritizing high-potential leads.
- Sales cycle length by score: This metric analyzes the sales cycle duration for leads with different scores. A shorter sales cycle for higher-scoring leads suggests the system is accurate.
Lead Generation Process Stages and Metrics
| Stage | Metrics |
|---|---|
| Lead Generation | Number of leads generated, Lead source, CPL |
| Lead Qualification | Lead qualification rate, Qualification time, Lead score |
| Lead Nurturing | Email open/click-through rates, Website engagement, Nurturing response rate |
| Lead Conversion | Conversion rate from nurtured leads, Sales cycle length |
Customer Acquisition Cost (CAC) and Return on Investment (ROI)
Understanding customer acquisition cost (CAC) and return on investment (ROI) is crucial for B2B businesses to assess the effectiveness of their marketing efforts. A high CAC without a corresponding return signals inefficiencies, while a low CAC coupled with a high ROI indicates a successful strategy. Analyzing these metrics provides actionable insights for optimizing marketing spend and maximizing profitability.
Calculating and Analyzing B2B Website CAC
Determining the cost of acquiring a new customer is paramount for evaluating marketing campaigns. To calculate CAC, divide the total marketing spend over a specific period by the number of new customers acquired during that period. This metric reveals how much each customer costs to acquire, offering insights into campaign effectiveness and resource allocation.
CAC = Total Marketing Spend / Number of New Customers
Tracking top B2B website metrics with Google Analytics is crucial for understanding your audience and improving conversion rates. Things like bounce rate, time on site, and pages per session are key indicators. However, ensuring your business is GDPR compliant is equally important, as it directly affects your data collection practices and website analytics. Consider if your website and data handling practices meet the requirements of GDPR, because that’s a crucial step in data privacy and security, before delving deeper into the intricacies of top B2B website metrics to monitor using Google Analytics.
A good place to start thinking about this is checking out this resource on is your business gdpr ready. This will help you understand how to approach GDPR compliance in your specific business context, which will then allow you to better understand and interpret your website data.
For example, if a company spent $10,000 on marketing and acquired 20 new customers, their CAC is $500. This allows for a comparison between different marketing channels and campaigns. Analyzing CAC trends over time helps identify areas for improvement. A significant increase in CAC might signal a need to adjust strategies or optimize campaigns.
Measuring Website Marketing Campaign ROI
Evaluating the return on investment (ROI) of marketing campaigns is essential for demonstrating their value. ROI measures the profitability of marketing initiatives, quantifying the return for every dollar invested. It is calculated by dividing the net profit generated by the total marketing investment.

ROI = (Net Profit / Total Marketing Investment) – 100%
For instance, if a marketing campaign generates $20,000 in profit and costs $10,000, the ROI is 100%. This metric enables businesses to assess the profitability of various campaigns and channels. High ROI campaigns should be prioritized and replicated. Low ROI campaigns warrant review and potential adjustments.
Comparing ROI Evaluation Methods
Different methods for evaluating ROI on website investments exist. One common approach is to track website traffic and conversions to measure the impact of marketing campaigns. Another method involves analyzing sales data and attributing revenue to specific campaigns. Comparing these approaches provides a more comprehensive picture of the effectiveness of marketing initiatives. Different methods may yield varying results, highlighting the importance of selecting the method that best aligns with the business objectives.
Optimizing CAC and Maximizing ROI
Best practices for optimizing CAC and maximizing ROI include focusing on high-value customer acquisition. This involves identifying the ideal customer profile (ICP) and targeting marketing efforts towards this profile. Employing data-driven insights and analytics to track campaign performance is critical for continuous optimization. Furthermore, leveraging multiple marketing channels can diversify acquisition strategies and potentially reduce CAC.
Marketing Channel CAC and ROI Comparison
| Marketing Channel | Typical CAC | Typical ROI | Description |
|---|---|---|---|
| Search Engine Marketing (SEM) | $50-$500 | 100%-300% | Pay-per-click advertising on search engines. |
| Social Media Marketing (SMM) | $25-$250 | 50%-200% | Targeted advertising and content creation on social media platforms. |
| Content Marketing | $100-$1000 | 150%-400% | Creating and distributing valuable content to attract and engage customers. |
| Email Marketing | $10-$100 | 20%-150% | Building relationships and driving conversions through email campaigns. |
| Referral Programs | Variable | High (often >300%) | Incentivizing existing customers to refer new business. |
The table above provides a general comparison of different marketing channels and their typical CAC and ROI. These figures are estimates and can vary significantly depending on the industry, target audience, and specific campaign strategies.
User Experience (UX) and Customer Satisfaction (CSAT) Metrics
Understanding how your B2B website visitors interact with your site is crucial. A positive user experience (UX) fosters trust and encourages engagement, ultimately leading to higher conversion rates and customer satisfaction. Measuring these elements provides actionable insights into areas needing improvement, allowing for a more effective and satisfying online experience.Evaluating user experience and customer satisfaction requires a multi-faceted approach.
Focusing solely on quantitative data like bounce rates can be misleading. A holistic view, incorporating qualitative feedback, helps uncover the ‘why’ behind the numbers. This allows for more targeted improvements, leading to a more meaningful and effective online experience for your B2B audience.
User Experience Metrics
User experience (UX) metrics provide a quantitative view of how visitors interact with your website. These metrics help to identify areas where improvements can be made to streamline the user journey and enhance their experience. Key UX metrics include time on site, bounce rate, pages per visit, and click-through rate. By tracking these metrics, you can gain valuable insights into how visitors interact with your website.
- Time on site: This metric indicates how much time visitors spend on your website. A longer time spent typically signifies a more engaging experience. A high time-on-site can indicate valuable content and a well-structured website that keeps users interested.
- Bounce rate: This represents the percentage of visitors who leave your website after viewing only one page. A high bounce rate often suggests that the landing page or initial content isn’t compelling enough to keep visitors engaged. It could also indicate that the site is difficult to navigate or the content isn’t relevant.
- Pages per visit: This metric shows the average number of pages a visitor views during a single session. A higher number suggests a deeper exploration of your site and a more engaging user experience.
- Click-through rate (CTR): This metric tracks the percentage of visitors who click on a specific link or call-to-action. A high CTR suggests that your calls-to-action are effective and well-placed.
Customer Satisfaction (CSAT) Metrics
Measuring customer satisfaction (CSAT) involves gathering feedback to understand how satisfied your customers are with your products, services, and website. Collecting feedback is crucial for understanding your customers’ needs and improving your service offerings.
- Surveys: Surveys are a direct way to gauge customer satisfaction. They can be implemented in various ways, including post-purchase surveys, feedback forms, and in-app surveys.
- Net Promoter Score (NPS): This metric measures customer loyalty and their willingness to recommend your products or services to others. NPS surveys ask customers how likely they are to recommend your company on a scale of 0-10.
- Customer Effort Score (CES): CES measures how easy it is for customers to interact with your website or company. Lower scores suggest more effort is required to complete a task.
- Customer Feedback Mechanisms: These include feedback forms, email inquiries, and social media listening. Collecting feedback from various channels provides a more comprehensive view of customer satisfaction.
Correlation Between UX and CSAT
A positive user experience directly correlates with higher customer satisfaction. A well-designed website that is easy to navigate and provides relevant information contributes to a positive user experience. This, in turn, increases customer satisfaction and loyalty. By addressing UX issues, businesses can improve CSAT scores.
| UX Metric | Impact on Customer Satisfaction |
|---|---|
| Ease of Navigation | High ease of navigation leads to higher satisfaction as users can find what they need quickly. |
| Clear Information Architecture | Users can easily understand and access information, leading to higher satisfaction. |
| Mobile Responsiveness | Responsive design ensures a seamless experience on various devices, enhancing satisfaction. |
| Fast Loading Speed | A fast-loading website is more user-friendly, contributing to a positive experience and higher satisfaction. |
| Intuitive Design | Simple and intuitive design makes the site easier to use, leading to higher satisfaction. |
Improving UX and CSAT
Improving both UX and CSAT requires a combination of analyzing data, gathering feedback, and implementing changes based on insights. Continuous monitoring and iterative improvements are crucial. Understanding user behavior through analytics and feedback mechanisms is critical for achieving positive results.
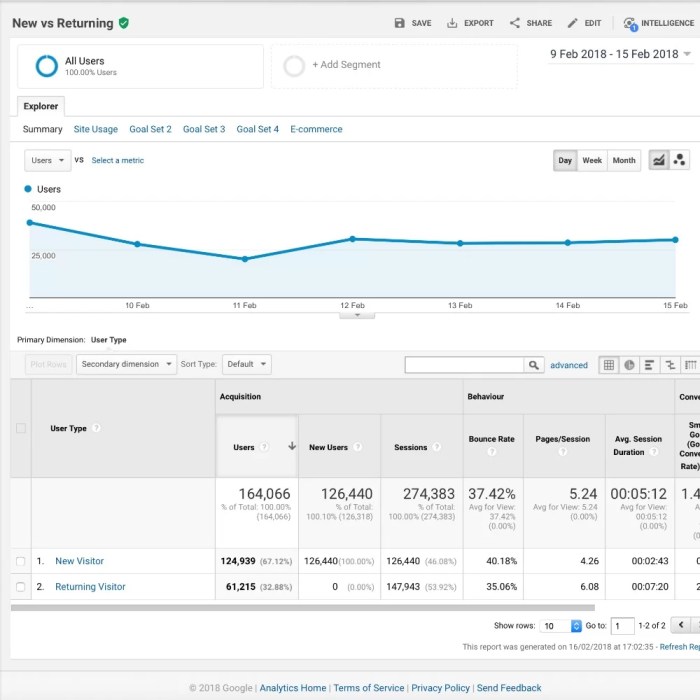
Utilizing Google Analytics for Monitoring
Unlocking the full potential of your B2B website requires more than just tracking traffic. Google Analytics provides the powerful tools to delve deeper into your audience, understand their behavior, and ultimately, optimize your strategies for maximum impact. This section focuses on leveraging Google Analytics to monitor key B2B website metrics, from setting up custom dashboards to integrating with your existing marketing ecosystem.A comprehensive understanding of your website data is crucial for informed decision-making.
Google Analytics empowers you to collect, analyze, and visualize your data, revealing insights that translate into tangible improvements in performance and profitability. This data-driven approach allows you to refine your strategies, target the right audience, and boost conversions.
Key Google Analytics Features for Tracking B2B Website Metrics
Google Analytics offers a wide array of features designed to track and analyze various B2B website metrics. These features provide detailed insights into user behavior, allowing for the optimization of marketing strategies and website performance. Crucial features include real-time tracking, allowing for immediate feedback on website activity, and detailed demographic and interest reports, enabling targeted marketing campaigns. These reports provide insights into visitor demographics, interests, and behaviors, allowing for targeted campaigns and content optimization.
Setting Up Custom Dashboards for Monitoring B2B Website Performance
Custom dashboards are essential for consolidating key metrics into a single, easily accessible view. This streamlined approach allows for quick identification of trends and anomalies. Google Analytics allows for the creation of customized dashboards by selecting specific metrics and dimensions to display. This customized view offers a personalized perspective, highlighting the aspects most relevant to your business objectives.
For example, a B2B SaaS company might create a dashboard that tracks new leads generated from specific marketing campaigns, alongside conversion rates and customer acquisition costs.
Creating Custom Reports and Visualizations
Custom reports and visualizations are powerful tools for extracting actionable insights from your data. Google Analytics allows you to create custom reports tailored to specific needs. These reports can encompass various metrics, such as bounce rate, time on site, and conversion rates, offering detailed analysis. These reports allow you to analyze performance by date, device, or source, allowing for precise targeting.
Visualization tools allow for the representation of data through charts and graphs, enhancing understanding and identification of patterns.
Integrating Google Analytics with Other Marketing Tools
Integrating Google Analytics with other marketing tools is critical for a holistic view of your marketing efforts. This integration enables the flow of data between platforms, providing a unified view of performance across various channels. Examples include connecting Google Analytics with CRM systems to track customer interactions and marketing automation platforms to monitor campaign performance. These integrations streamline the workflow and enable better collaboration between different teams.
Comparing Google Analytics Reporting Options
Different reporting options within Google Analytics cater to varying needs and preferences. A comparative analysis can help in selecting the most suitable option.
| Reporting Option | Description | Use Cases |
|---|---|---|
| Real-time Reporting | Provides immediate insights into current website activity. | Monitoring campaign performance, identifying traffic spikes, and resolving immediate issues. |
| Audience Reports | Provides demographics, interests, and behavior of website visitors. | Targeting specific audience segments, optimizing content, and personalizing user experience. |
| Acquisition Reports | Shows how users arrive at your website. | Identifying high-performing marketing channels, improving , and optimizing paid campaigns. |
| Behavior Reports | Tracks user interactions on your website. | Understanding user journey, improving website navigation, and identifying areas for conversion optimization. |
| Conversions Reports | Tracks goals and conversions on your website. | Measuring the success of marketing campaigns, identifying high-converting pages, and optimizing conversion funnels. |
Last Point: Top B2b Website Metrics To Monitor Using Google Analytics

In conclusion, monitoring key B2B website metrics using Google Analytics is essential for success in today’s digital landscape. By meticulously tracking traffic, engagement, conversions, and customer acquisition, businesses can gain valuable insights into their website’s performance and make data-driven decisions. This in-depth analysis allows for targeted improvements and ultimately leads to increased revenue and profitability. The actionable insights derived from this process are critical to staying competitive and thriving in the ever-evolving digital marketplace.