The new beta Google Analytics interface is here, and it’s bringing a whole new level of data analysis to the forefront. This comprehensive overview delves into the key changes, from enhanced data visualization to improved user experience, and explores how this innovative interface impacts data collection and reporting. We’ll also examine its integrations with other Google products and potential challenges, along with a glimpse into its future.
Get ready to see how this beta interface is revolutionizing the way we analyze website performance.
The interface boasts significant design changes compared to its predecessor, streamlining the process of collecting, visualizing, and interpreting crucial website data. Expect a more intuitive layout, new chart types, and powerful customization options. This beta release is poised to transform how businesses understand and respond to website traffic and user behavior. We’ll explore how this interface empowers users to extract actionable insights from their data, with practical examples and detailed explanations.
Introduction to the New Google Analytics Beta Interface
The new beta interface for Google Analytics represents a significant shift in how users interact with and interpret their website data. This update prioritizes clarity and ease of use, aiming to provide a more intuitive and comprehensive view of website performance. The core design philosophy is to streamline the process of extracting actionable insights from complex data sets, making it simpler to identify trends, understand user behavior, and optimize website strategies.This new interface reimagines the presentation of data, moving away from the potentially overwhelming layout of the previous version towards a more structured and focused approach.
Key improvements focus on visual clarity, streamlined navigation, and a more user-friendly experience, especially for those less familiar with the previous analytics tools. The new features are intended to be more accessible, enabling quicker identification of key performance indicators (KPIs) and patterns.
Key Design Changes
The previous version often presented data in a way that could be difficult to navigate and interpret. The new beta interface addresses this by employing a more modern and intuitive design. Instead of a large, potentially overwhelming dashboard, the new interface breaks down the data into smaller, more manageable sections. Visualizations are more prominent and interactive, allowing for faster comprehension of key metrics.
The overall look and feel is more visually appealing, with a cleaner layout that reduces clutter and improves readability.
Core Functionalities Introduced
The new beta interface introduces several new functionalities to enhance the user experience and facilitate deeper data analysis. This includes enhanced segmentation options, enabling users to drill down into specific user groups to understand their behavior in more detail. Furthermore, the introduction of interactive charts and graphs makes it easier to spot trends and patterns within the data, providing quicker insight into the performance of different website elements.
Example Interface Structure
The new interface is structured to prioritize clarity and ease of use. This is achieved by organizing data in a way that emphasizes visual representation. Here’s a table illustrating a simplified example:
| Metric | Value | Visualization |
|---|---|---|
| Unique Visitors | 15,283 | Bar graph showing growth compared to previous week |
| Bounce Rate | 32% | Pie chart showing breakdown by source |
| Average Session Duration | 2 minutes 45 seconds | Line graph illustrating trend over time |
This table exemplifies how the interface presents key metrics with visual representations, allowing users to quickly grasp the performance of their website. Each metric is displayed with its corresponding value and a visualization, making it easier to understand the overall performance.
Enhanced Data Visualization
The new Google Analytics beta interface boasts significant improvements in data visualization, offering a more intuitive and powerful way to understand website performance. This enhanced visual representation allows for quicker identification of trends and patterns, enabling data-driven decisions with greater clarity and efficiency. The new interface goes beyond simply displaying data; it helps users actively engage with the information and extract actionable insights.
New Chart Types
The beta interface introduces several innovative chart types beyond the standard line and bar graphs. These include interactive scatter plots, enabling the exploration of relationships between multiple metrics, and heatmaps, which offer a clear visual representation of user behavior across different segments and time periods. These dynamic visualizations provide a richer understanding of user interactions and website performance.
Customization Options
The new interface provides a plethora of customization options for charts and dashboards. Users can now easily adjust colors, fonts, and other visual elements to match their brand aesthetics. This level of control allows users to tailor the visualizations to specific needs and preferences. Furthermore, the ability to filter and segment data directly within the visualization allows users to pinpoint the exact areas of interest, further enhancing the analytic process.
Interactive controls for zooming, panning, and data selection within the charts are also provided, allowing for a deeper exploration of the data.
Comparison Table: Old vs. New Interface
| Feature | Old Interface | New Interface |
|---|---|---|
| Chart Types | Limited to line, bar, and pie charts | Includes interactive scatter plots, heatmaps, and more; dynamic visualizations |
| Customization | Limited color and font options | Full customization options for color, font, and visual elements |
| Data Filtering | Requires separate steps for filtering | Direct filtering and segmentation within visualizations |
| Interactivity | Static charts; limited interaction | Interactive charts with zooming, panning, and data selection |
| Dashboard Design | Limited dashboard layouts | Flexible dashboard layouts; multiple visualizations can be combined |
Visualizing Specific Metrics
Example 1: Comparing Acquisition Channels
The new interface facilitates effective comparisons of acquisition channels. Users can visualize the contribution of different marketing campaigns (e.g., social media, paid search) to website traffic using interactive bar charts and comparative data.
| Acquisition Channel | Sessions (New Interface) |
|---|---|
| Social Media | 12,500 |
| Paid Search | 8,000 |
| Organic Search | 15,000 |
Example 2: Understanding User Behavior over Time
A heatmap visualization in the new interface can effectively illustrate user behavior over time. For instance, a heatmap might highlight peak traffic periods, allowing for strategic scheduling of content or promotions.
| Date | Time of Day | Session Count |
|---|---|---|
| 2024-03-15 | 10:00 – 11:00 | 500 |
| 2024-03-15 | 14:00 – 15:00 | 750 |
Improved User Experience
The new Google Analytics beta interface prioritizes a significant improvement in user experience, moving beyond the sometimes-overwhelming complexity of the previous version. This enhanced experience aims to streamline data exploration and analysis, making it easier for users to quickly identify key insights from their data. The updated design emphasizes intuitive navigation and clear presentation of data, boosting overall usability.The core objective of the beta interface is to empower users to efficiently navigate and interpret their data.
This is achieved through a series of thoughtful design choices and technological advancements, offering a significant improvement in usability compared to the previous iteration. These changes are particularly noticeable in the areas of navigation, filtering, and data visualization.
Navigation Enhancements
The new interface features a significantly reorganized navigation structure. The previous version’s cluttered layout has been replaced with a more intuitive and streamlined approach. This includes a clearer hierarchy of reports and dashboards, allowing users to quickly access the information they need. The menu structure is now more accessible, reducing the need for extensive searching. This improved structure leads to faster and more effective data retrieval.
Filtering Options
The beta interface introduces more sophisticated filtering options. Users can now apply filters with greater precision and granularity, allowing for more targeted data analysis. Customizable filters provide a wide range of possibilities, enabling users to isolate specific data points relevant to their needs. This level of control was previously limited, making it more difficult to focus on specific metrics or segments.
The improved filtering functionality dramatically enhances the ability to analyze and interpret data with greater accuracy and depth.
Data Exploration Capabilities
The new interface offers expanded data exploration capabilities. Interactive dashboards and visualizations provide users with a dynamic way to view and interact with their data. The enhanced visualizations provide a comprehensive view of key performance indicators (KPIs) in a clear and concise format. Users can now drill down into specific data points and explore trends more effectively.
These improvements enable a more detailed understanding of business performance and user behavior. This dynamic exploration enables users to easily discover hidden patterns and relationships in the data, which were not readily apparent in the previous version.
Usability
The new interface exhibits a higher degree of user-friendliness and ease of use. The intuitive design and streamlined navigation contribute to a positive user experience. The clear presentation of data makes it simpler to identify key metrics and trends. The previous version often required significant effort to locate specific data points. The improved usability of the beta interface results in faster analysis and more effective decision-making.
Comparison with Previous Version
The new Google Analytics beta interface represents a significant leap forward in user experience compared to the previous version. The previous version often felt cumbersome, with its complex navigation and limited filtering options. The new interface’s streamlined design and enhanced features make it significantly more user-friendly. The improved data exploration capabilities and intuitive navigation empower users to analyze data more effectively and derive actionable insights more readily.
I’ve been playing around with the new beta Google Analytics interface, and it’s pretty cool. Figuring out the best way to analyze all that data, though, often means juggling multiple calls with colleagues. To ensure smooth collaboration, checking out the options for best conference call services is crucial. Ultimately, the new interface makes gathering data more efficient, but clear communication tools are equally important for putting it to good use.
This improved user experience translates into a more productive and efficient workflow for data analysis.
Data Collection and Reporting
")
The new Google Analytics beta interface offers a significant shift in how data is collected and presented. This revised approach streamlines the process, making it easier to understand key performance indicators (KPIs) and identify actionable insights. The enhanced visualization tools, combined with improved data collection methods, empower users to gain a deeper understanding of website traffic and user behavior.The revamped system introduces a more intuitive way to track website interactions.
This translates into faster data analysis, quicker identification of trends, and more efficient reporting on key metrics. Improved data collection processes ensure a more comprehensive view of website performance.
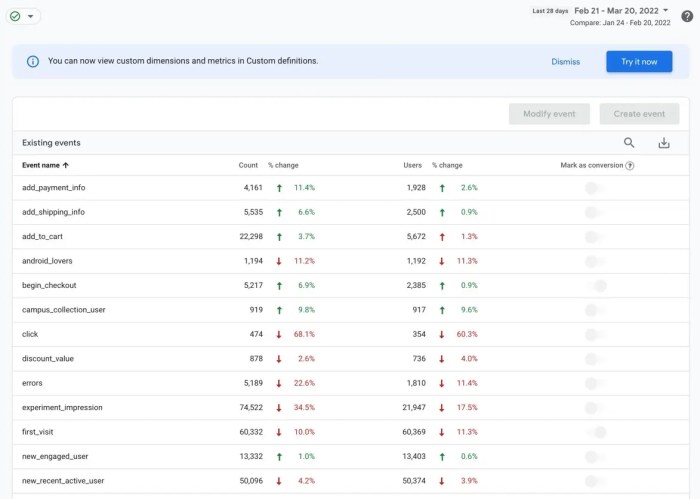
Event Tracking Enhancements
Event tracking in the new beta interface has been significantly refined. This allows for a deeper understanding of user engagement beyond traditional page views. The enhanced categorization system allows for more granular tracking of specific user actions. This includes features like custom event parameters to capture more detailed data on user interactions. This allows marketers to analyze user journeys and pinpoint the most effective user engagement strategies.
A crucial change is the ability to set up event triggers based on specific user actions.
Custom Dimensions and Metrics
The interface now provides greater flexibility in defining custom dimensions and metrics. This allows users to tailor the data to meet their specific business needs. This facilitates the collection of data that is directly relevant to the company’s goals. Users can easily create custom dimensions and metrics, such as campaign source or product category, which are crucial for more targeted reporting and analysis.
The expanded options for custom dimensions and metrics facilitate the analysis of user behavior and website interactions.
Data Collection Setup and Configuration
Setting up and configuring the new interface for data collection is straightforward. The step-by-step procedure involves these key steps:
- Account Setup: Choose the appropriate account type and configure the necessary settings.
- Property Configuration: Set up the properties for the website or app you want to track. This includes defining the scope of data collection.
- Tag Implementation: Add the tracking code to your website or app. This code is crucial for capturing data on user interactions.
- Event Tracking Setup: Define the events you want to track, and specify the parameters that will be collected.
- Custom Dimension and Metric Creation: Define the custom dimensions and metrics needed for more targeted reporting.
- Data Validation: Verify the data collection setup to ensure that all events and metrics are being tracked correctly.
Supported Data Collection Methods
The new beta interface supports a variety of data collection methods.
| Data Collection Method | Description | Example |
|---|---|---|
| Universal Analytics | Existing Universal Analytics data can be imported and integrated into the new interface. | Importing existing data to analyze historical trends. |
| Event Tracking | Captures user interactions beyond page views. | Tracking button clicks, form submissions, or video plays. |
| Custom Dimensions | Allows for the creation of custom categories to track specific user behaviors or characteristics. | Tracking the user’s device type (desktop, mobile) or referring source. |
| Custom Metrics | Allows for the creation of custom numerical values to measure specific actions or attributes. | Tracking the number of products added to a cart or the duration of a video viewed. |
Integration with Other Google Products: The New Beta Google Analytics Interface
")
The new Google Analytics beta interface isn’t an isolated island; it’s deeply integrated with the broader Google ecosystem. This seamless connection allows users to gain a holistic view of their online performance, moving beyond individual product insights to a comprehensive understanding of the entire user journey. This integration streamlines data analysis, providing a richer understanding of user behavior and campaign effectiveness.The improved integration with Google Ads, Search Console, and other Google products enhances data correlation and analysis, allowing for more effective optimization strategies.
Instead of needing separate dashboards and reports, users can now analyze data from various sources in one place, saving time and effort. This unified approach enables a deeper understanding of the interconnectedness of marketing efforts and website performance.
Integration with Google Ads
The integration with Google Ads is significantly enhanced in the beta interface. Users can now directly import and analyze campaign performance data within the Analytics interface. This feature enables a comprehensive view of how website traffic interacts with various advertising campaigns. A real-world example is observing how specific ad campaigns drive unique traffic to particular pages on a website, allowing for quick adjustments to maximize campaign ROI.
Integration with Search Console
The new interface facilitates direct connection and data import from Search Console. This integration allows users to see how their website’s search performance correlates with overall traffic and engagement. For instance, identifying s driving traffic and linking them to specific pages’ performance provides valuable insight into content optimization. This seamless connection helps identify areas for improvement in search engine visibility and website traffic.
Integration with Other Products
Integration with other Google products is also improved. Users can now link and analyze data from Google My Business, Google Merchant Center, and others. This comprehensive view helps understand the impact of various marketing channels on overall performance. For example, analyzing how local searches from Google My Business affect website traffic provides a more complete picture of the customer journey.
I’ve been diving into the new beta Google Analytics interface, and it’s definitely a game-changer. Understanding your website traffic is crucial, but keeping track of all that data can be overwhelming. To really make the most of that data, planning your social media content effectively with a tool like a social media content calendar is essential.
Ultimately, this new interface helps you analyze your online presence, so you can tailor your strategy to better engage your audience.
Integration Process Overview
The integration process is streamlined, requiring fewer steps and more intuitive controls. A dedicated “Connections” section in the interface manages all linked accounts.
| Step | Action | Description |
|---|---|---|
| 1 | Access Connections | Navigate to the “Connections” section in the interface. |
| 2 | Select Product | Choose the Google product (e.g., Google Ads, Search Console) to integrate. |
| 3 | Authorize Access | Grant the necessary permissions to allow data sharing. |
| 4 | Data Synchronization | The interface automatically synchronizes data from the linked product. |
Learning Resources and Support
Navigating a new interface can be challenging, but Google Analytics has a robust support system to ease the transition. This section Artikels the various resources available to help you master the new beta interface and troubleshoot any issues. From in-depth documentation to active community forums, you’ll find everything you need to feel confident using the new tools.The new Google Analytics beta interface offers a wealth of learning materials, ensuring a smooth transition for all users.
These resources cater to different learning styles, from quick tutorials to detailed documentation. We’ve also included a dedicated support system to address any questions or problems you may encounter.
Available Learning Resources
Comprehensive documentation is essential for understanding the new features and functionalities. This includes detailed explanations of each feature, step-by-step tutorials, and illustrative examples.
- Online Documentation: Detailed guides, FAQs, and how-to articles are readily available on the official Google Analytics Help Center. These resources cover everything from basic setup to advanced reporting techniques.
- Video Tutorials: Short, informative videos demonstrate key features and functionalities. These tutorials can be accessed directly from the Help Center and provide a visual understanding of the new interface.
- Interactive Tutorials: Hands-on exercises and interactive walkthroughs provide practical experience with the new interface. These interactive tutorials allow you to experiment with the features and gain a better understanding of their application.
Community Support Forums
Connecting with other users and sharing experiences can be invaluable when learning a new tool. Active community forums provide a platform for discussion and problem-solving.
- Google Analytics Community Forums: Engage with a supportive community of fellow analysts, ask questions, and share solutions. This is a great place to get quick answers to common questions and discover solutions to unique challenges.
Troubleshooting and Support
Troubleshooting common issues is critical for maintaining workflow efficiency. The following steps Artikel how to effectively seek help and address problems encountered.
- Search the Help Center: Start by searching the official Google Analytics Help Center for solutions to your specific issue. The Help Center often provides detailed answers and relevant articles.
- Utilize Community Forums: If you cannot find a solution in the Help Center, post your question in the Google Analytics Community Forums. You may find that others have encountered similar problems and have already found solutions.
- Submit a Support Ticket: For more complex issues or problems requiring personalized assistance, you can submit a support ticket directly to Google support. This option ensures that your issue is addressed by a Google representative.
New Support Resources
The new beta interface comes with dedicated support resources, specifically tailored to address user needs.
- Dedicated Support Team: A dedicated team is available to address complex issues and provide personalized support. This support team is equipped to handle more complex technical issues.
- Beta Testing Feedback Channels: Dedicated channels are available for feedback, allowing users to provide valuable input and suggestions for improvement. This ensures that the interface continues to evolve based on user needs.
Potential Challenges and Limitations
The new Google Analytics beta interface, while promising enhanced features, may present some challenges for users. Understanding potential pitfalls ahead of time can help users navigate the transition and maximize the benefits of the new platform. These challenges can range from technical difficulties to learning curves, requiring careful consideration and preparation.The new interface, with its complex data visualizations and integrations, may initially seem overwhelming to users accustomed to simpler interfaces.
Addressing these potential obstacles early on is crucial to ensuring a smooth transition and a positive user experience.
Learning Curve and User Familiarity
The new interface introduces a significantly different approach to data visualization and analysis compared to previous versions. Users accustomed to the older interface may find it challenging to adapt to the new layout, navigation, and features. This transition can be time-consuming and require significant effort to learn the new functionalities. This learning curve can be mitigated by providing comprehensive documentation, tutorials, and interactive training modules.
The new beta Google Analytics interface is looking pretty slick, but I’m noticing a few things about the data security. It’s crucial to ensure that all the data transfers are secure, especially when dealing with user information. Understanding how SSL certificates work is key to this; what is ssl certificate is a great starting point.
Ultimately, the new interface needs to prioritize robust security measures to build user trust and maintain data integrity.
Data Migration and Compatibility Issues
Migrating existing data from the previous interface to the new beta version could potentially introduce compatibility issues. Data formats, configurations, and reporting structures may need adjustments to ensure seamless integration. This is especially important for users with complex reporting setups and custom dashboards.
Data Security and Privacy Concerns
Users must ensure that data security and privacy procedures are followed during the migration and usage of the new interface. This requires a careful assessment of data protection protocols, including authentication methods, access controls, and data encryption. Users must adhere to privacy regulations, such as GDPR, and verify that the new interface aligns with these requirements.
Technical Support and Troubleshooting
The availability and quality of technical support are crucial for users experiencing difficulties. The beta phase might encounter bugs or glitches that need to be resolved promptly. Users must have access to effective support channels to help them resolve any problems they encounter during the transition.
Integration with Other Google Products
Smooth integration with other Google products is essential for users reliant on workflows involving multiple tools. Issues could arise if the data flow between Google Analytics and other products is not seamless. Ensuring compatibility and proper configuration across platforms is important to avoid workflow disruptions.
Limited Customization Options (Initial Phase)
While the new interface offers enhanced visualization, the initial beta version might have limitations in terms of customization options compared to the previous version. Users who heavily rely on specific custom reports or dashboards might encounter constraints. The beta version likely prioritizes core functionality and may introduce more customization options in future iterations.
Future Outlook and Trends
The new Google Analytics beta interface represents a significant evolution in data visualization and user experience. Anticipating future developments is crucial for understanding how this interface will shape the analytics landscape. This section explores the potential future of the interface, including trends in interface design, its alignment with broader industry trends, and possible scenarios for its evolution.
Anticipated Future Developments, The new beta google analytics interface
The new beta interface is likely to see continuous improvements in its data processing and visualization capabilities. Expect enhanced real-time data analysis features, allowing for quicker insights into performance fluctuations. Further integration with other Google products, such as Google Ads and Google Marketing Platform, is anticipated, creating a more holistic view of marketing campaigns. Improved accessibility features, catering to a wider range of users, are also a likely development.
Potential Future Trends in Interface Design
The interface design trends will likely mirror broader web design advancements. Expect an increasing focus on intuitive navigation, with clear visual hierarchies and interactive elements. The incorporation of AI-powered features, such as automated insights and predictive modeling, will likely become more prevalent, streamlining the analysis process. Accessibility considerations, including support for various screen sizes and assistive technologies, will remain a crucial design principle.
Alignment with Broader Industry Trends
The new Google Analytics interface aligns with the industry trend toward data-driven decision-making. The emphasis on enhanced visualizations and intuitive reporting supports this trend. The interface also reflects the growing importance of real-time data analysis, a key component in modern marketing strategies. Furthermore, its integration with other Google products fosters a comprehensive ecosystem for data analysis, aligning with the increasing trend toward interconnected data platforms.
Possible Scenarios for the Future Interface
The future interface development could manifest in several scenarios:
- Scenario 1: Enhanced Real-time Analytics: The interface might evolve to provide near real-time data updates, enabling marketers to respond instantly to changing market conditions. This could involve incorporating more dynamic dashboards and interactive visualizations that immediately reflect changes in key metrics.
- Scenario 2: AI-Powered Insights: Integration of artificial intelligence could lead to automated insights and predictive modeling. The interface could offer proactive recommendations based on historical data and current trends, potentially helping users identify potential issues or opportunities before they manifest.
- Scenario 3: Extended Integration with Other Products: Further integration with Google’s suite of marketing products (like Google Ads and Google Search Console) could create a unified data ecosystem. This would enable a more holistic view of marketing performance across different channels.
- Scenario 4: Emphasis on Data Storytelling: The interface could focus more on visually compelling data storytelling. This could involve interactive dashboards, dynamic visualizations, and simplified reporting features that translate complex data into easily understandable narratives. This approach would make data analysis more accessible and insightful to a broader audience.
Final Summary
In conclusion, the new beta Google Analytics interface represents a substantial leap forward in web analytics tools. Its enhanced visualization, user-friendly design, and seamless integration with other Google products promise a more efficient and insightful data analysis experience. While potential challenges exist, the interface’s overall potential to revolutionize how we understand and interact with website data is undeniable. The future of web analytics is undoubtedly brighter thanks to this beta interface.