Real time reports google analytics – Real-time reports Google Analytics offer a dynamic view of website performance, letting you see how visitors interact with your site in the moment. This goes beyond the typical reports, providing immediate insights into trends and events. Imagine seeing how a new marketing campaign is impacting traffic in real time, or understanding why a specific page is experiencing a sudden surge in visitors.
This level of immediacy can revolutionize your website optimization strategy, allowing you to adapt to changes on the fly and react to sudden spikes or drops in traffic.
This in-depth guide explores the capabilities of real-time reporting in Google Analytics, from understanding its features to using the data for effective A/B testing. We’ll cover how to visualize this data effectively and how to integrate it with other tools for a comprehensive overview of your business performance. We’ll also look at troubleshooting common issues and best practices for using real-time data to make informed decisions and improve your website.
Real-time Reporting Capabilities in Google Analytics
Google Analytics’ real-time reporting offers a dynamic view of website activity, providing valuable insights into how users interact with your site in the present moment. This feature allows for immediate adjustments to campaigns and content to optimize performance in real-time. It’s a powerful tool for understanding user behavior and identifying trends as they unfold.Real-time data differs significantly from standard reports, which provide historical data aggregated over time.
Real-time reporting focuses on current activity, offering a snapshot of what’s happening on your website at any given moment. This allows for quick responses to issues, changes in user behavior, and the optimization of campaigns in progress.
Real-time Features Overview
Real-time reporting in Google Analytics provides a comprehensive view of current website activity. It’s not just about raw numbers; it’s about understanding the context behind those numbers. The data reveals how users are interacting with different pages, sources of traffic, and the overall performance of your website. This information is crucial for making immediate decisions to improve user experience and achieve better results.
Comparison with Standard Reports
Real-time reports differ fundamentally from standard reports. Standard reports summarize website performance over specific time periods, typically days, weeks, or months. Real-time reports, on the other hand, offer a live view of website activity. The focus is on current trends and immediate responses, rather than historical analysis. The comparison lies in the immediacy and the focus on current behavior versus historical patterns.
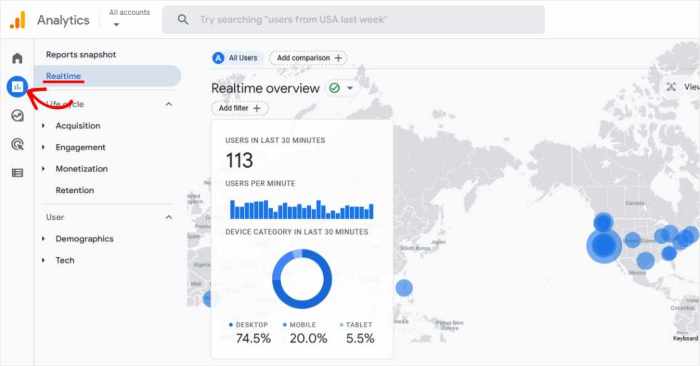
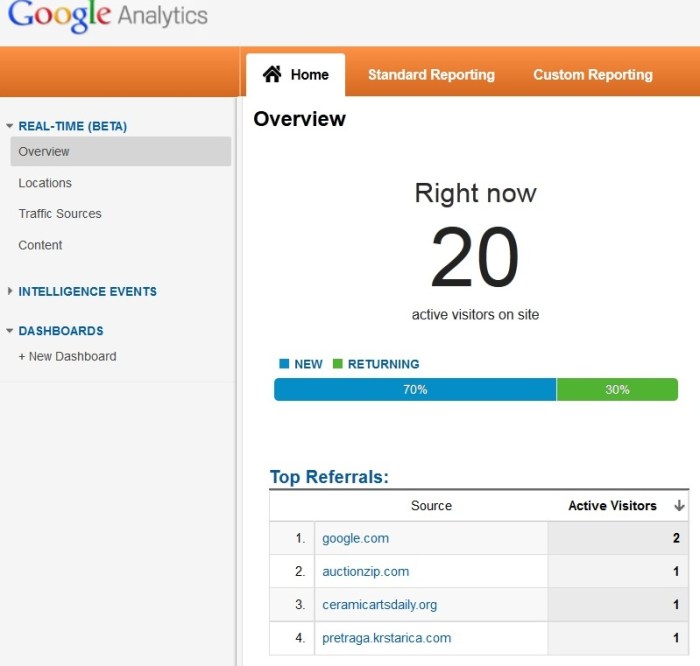
Accessing and Navigating the Real-time Dashboard
The real-time dashboard is easily accessible within Google Analytics. To navigate, simply select the “Real-time” report from the main navigation menu. The dashboard provides an intuitive layout, making it easy to filter and analyze the data. Specific sections are organized logically for user interaction, enabling quick identification of key metrics and their corresponding sources.
Tracking Website Performance During Events
Real-time data is exceptionally useful for tracking website performance during specific events, such as product launches, promotions, or social media campaigns. By monitoring key metrics in real-time, you can identify sudden spikes in traffic, understand the impact of promotional campaigns, and adjust strategies accordingly. This dynamic feedback loop is critical for optimizing campaigns in real-time and capitalizing on trending opportunities.
Key Metrics in Real-time Reports
Real-time reporting offers a range of metrics to track website performance. These metrics offer insights into user behavior and traffic sources in real-time.
Real-time reports in Google Analytics are super helpful for quick insights, but ultimately, a killer pricing page like the one at pricing page that converts is crucial for turning those insights into actual sales. Understanding customer behavior and optimizing your pricing strategy is key to improving conversion rates, which directly impacts the effectiveness of those real-time reports.
So, focusing on the right pricing model is essential for maximizing the value of your Google Analytics data.
| Metric | Description | Example Value |
|---|---|---|
| Users | Number of unique visitors currently on the site. | 123 |
| Sessions | Number of current sessions (visits) occurring. | 87 |
| Pageviews | Number of pages viewed in real-time. | 150 |
| Bounce Rate | Percentage of visitors who leave the site after viewing only one page. | 25% |
| Source/Medium | The origin of the current traffic. | Social (Facebook) |
| Traffic | Total traffic volume currently on the site. | 1.2k |
| Events | Number of specific actions taken by users. | 23 |
Use Cases for Real-Time Data: Real Time Reports Google Analytics
Real-time data in Google Analytics provides a dynamic view of website activity, offering valuable insights for immediate action. This immediacy allows businesses to react to trends, optimize campaigns, and understand customer behavior in the moment. The ability to see how users interact with a website in real-time empowers proactive adjustments, leading to enhanced user experience and improved conversion rates.
Optimizing Website Performance
Real-time data allows for immediate identification of website bottlenecks or performance issues. For example, if a particular page is experiencing unusually high bounce rates or slow loading times, real-time data can pinpoint the problem area, enabling immediate troubleshooting and optimization. This can involve adjusting caching strategies, optimizing images, or resolving server issues. Quick responses to these issues minimize negative user experience and prevent loss of potential customers.
Adapting to Changing Trends
Real-time analytics reveal immediate shifts in user behavior and preferences. This is crucial for businesses to adapt to evolving trends and remain competitive. For example, a surge in interest in a specific product category can be detected in real-time, allowing companies to adjust inventory, promotional campaigns, and product offerings accordingly. This flexibility allows for swift response to changes in demand, preventing a loss of market share.
Importance in A/B Testing
Real-time data is invaluable for A/B testing. By monitoring the performance of different versions of a webpage or campaign in real time, businesses can quickly assess which version is performing better and make data-driven decisions. This allows for more rapid iterations and enhancements, maximizing the effectiveness of the testing process. For example, if one version of a landing page is converting significantly better than another, real-time data can provide this insight quickly, enabling immediate implementation of the winning variation.
Use Case Examples
Real-time data enables proactive adjustments to website elements, campaigns, and operations. This table highlights some key use cases.
| Use Case | Action | Expected Outcome |
|---|---|---|
| Identifying Traffic Sources | Monitor real-time traffic sources to understand where users are coming from. | Identify top-performing marketing channels and adjust strategies accordingly. |
| Monitoring Page Performance | Analyze real-time page views, bounce rates, and time on page. | Identify slow-loading pages or pages with high bounce rates and optimize accordingly. |
| Real-time Campaign Analysis | Track the effectiveness of real-time campaigns by monitoring engagement metrics. | Adjust campaign messaging or targeting based on real-time performance data. |
| Detecting and Addressing Issues | Monitor website performance metrics in real-time for issues like high error rates or slow loading times. | Promptly resolve technical issues to ensure a seamless user experience. |
Real-Time Data Visualization
Real-time data, as captured by Google Analytics, offers a dynamic view of website activity. This immediacy allows businesses to react quickly to trends and optimize campaigns in real-time. Effective visualization is crucial to glean actionable insights from this fast-moving information. Visual representations transform raw data into easily digestible patterns and trends, facilitating swift decision-making.Visualizing real-time data in Google Analytics involves transforming numerical and categorical information into graphical formats, such as charts and graphs.
This transformation makes it possible to identify and understand patterns, trends, and anomalies in website traffic, user behavior, and campaign performance instantaneously. The immediacy of the visualizations is a significant advantage, enabling businesses to adapt strategies in response to emerging patterns in real-time.
Real-time reports in Google Analytics are fantastic for quick insights, but to truly optimize your website for conversions, you need to delve deeper. Understanding how users interact with your site, from initial landing page to final purchase, is crucial for success. This often involves a strategy focused on SEO for conversion funnel, which analyzes user behavior and adjusts content to improve conversions.
A strong SEO for conversion funnel strategy will allow you to fine-tune your website to optimize user experience and maximize sales. Real-time reports, in turn, provide valuable feedback on the effectiveness of those adjustments, enabling you to iterate and refine your approach continuously. seo for conversion funnel is a great place to start learning more.
Different Visualization Methods for Real-Time Data
Various chart types can effectively display real-time data. Choosing the right chart is crucial for highlighting specific aspects of the data. Line charts are excellent for illustrating trends over time. Bar charts effectively compare different categories or segments, and scatter plots can reveal correlations between variables. Choosing the right visualization type directly impacts the clarity and impact of the message derived from the data.
Real-Time Charts and Graphs Examples
A real-time line graph, for example, could show the number of website visitors over the past hour, clearly indicating peaks and valleys in traffic. A bar chart could display the real-time performance of different marketing campaigns, enabling quick identification of high-performing campaigns and potential areas for improvement. A scatter plot could visualize the relationship between the number of ads displayed and the number of conversions, revealing potential correlations.
Tailoring Visualizations for Specific Insights
To highlight specific aspects of real-time data, visualizations can be customized with filters and segmentation. For instance, a line chart showing visitor traffic can be segmented by source (e.g., social media, search engine) to understand which channels are driving real-time traffic. Color-coding can highlight specific segments, and interactive elements can allow users to drill down into the data.
Importance of Choosing Appropriate Visualization Methods
The selection of a visualization method is critical for extracting meaningful insights. A poorly chosen visualization can obscure key patterns and mislead decision-making. For example, a pie chart might not be the best choice for illustrating real-time trends, as it primarily focuses on static proportions. A line graph, on the other hand, is better suited to display changes over time.
Comparison of Visualization Types, Real time reports google analytics
| Visualization Type | Strengths | Weaknesses |
|---|---|---|
| Line Chart | Excellent for showing trends over time, highlighting fluctuations, and identifying anomalies. | Less effective for comparing different categories directly. |
| Bar Chart | Effective for comparing different categories or segments, easily highlighting differences. | Less effective for showing trends over time. |
| Scatter Plot | Useful for revealing correlations between variables, identifying relationships between factors. | Can become cluttered with large datasets, making it harder to discern patterns. |
| Pie Chart | Good for illustrating proportions of different categories. | Not ideal for real-time data as it doesn’t effectively show changes over time; better for static data. |
Integrating Real-Time Data with Other Tools
Real-time data from Google Analytics provides a dynamic snapshot of website performance. However, the true power of this data lies in its ability to inform and automate actions across your entire business ecosystem. By integrating this real-time feedback with other crucial tools, businesses can gain a holistic understanding of performance, enabling proactive adjustments and optimized strategies.Integrating real-time data isn’t just about seeing what’s happening; it’s about reacting to it.
This integration allows for the development of dynamic dashboards, triggering automated responses to trends, and providing a unified view of key performance indicators (KPIs) across different platforms. This fosters a more agile and responsive approach to business operations.
Methods for Integrating Real-Time Data
Integrating real-time Google Analytics data with other tools often involves leveraging APIs (Application Programming Interfaces). These APIs allow seamless data exchange between platforms, enabling businesses to pull real-time metrics into their preferred systems. Data can be processed and visualized within these tools, enhancing the understanding of ongoing performance. Furthermore, real-time data feeds can be designed to trigger automated actions based on pre-defined conditions, such as a sudden drop in conversions or a surge in traffic from a specific source.
Creating a Holistic View of Business Performance
Integrating real-time Google Analytics data with other business tools provides a comprehensive view of performance. Imagine connecting real-time website traffic data with CRM (Customer Relationship Management) data. This integration reveals the customer journey in real-time, enabling businesses to understand customer behavior, identify trends, and adjust marketing strategies on the fly. Furthermore, linking real-time sales data with website traffic data allows businesses to see the immediate impact of marketing campaigns and make data-driven decisions.
Triggering Automated Actions
Real-time data integration enables automated actions based on predefined triggers. For example, if a specific generates a sudden surge in traffic to a particular product page, an automated email marketing campaign could be triggered to promote that product. Alternatively, if a particular campaign results in a significant drop in conversion rates, real-time data integration can trigger an alert to the marketing team, enabling immediate adjustments to the campaign.
Automated responses are crucial for maintaining optimal performance and mitigating potential issues.
Steps for Setting Up Data Integration
Setting up data integration involves several key steps:
- Identify the tools to integrate: Determine the specific tools that need to be integrated with Google Analytics real-time data. Consider the data sources you already use and what insights you want to gain.
- Choose an integration method: Evaluate the available methods for integrating data, such as APIs, third-party connectors, or custom scripts.
- Establish data mappings: Define the specific data fields to be transferred between Google Analytics and the external tools. This ensures accurate and meaningful information is shared.
- Configure the integration settings: Implement the chosen integration method by setting up the appropriate configurations within each tool.
- Test the integration thoroughly: Thoroughly test the integration to ensure data is transferred accurately and reliably. Monitor data consistency and identify any potential issues.
Integration Tools and Compatibility
The following table provides examples of integration tools and their compatibility with Google Analytics real-time data. This is not an exhaustive list, and compatibility can vary depending on specific tool versions and configurations.
| Integration Tool | Compatibility with Google Analytics Real-Time Data |
|---|---|
| Google Data Studio | High compatibility; real-time dashboards can be created |
| Zapier | High compatibility; allows for automated workflows and actions |
| Mailchimp | Moderate compatibility; real-time data can be used to trigger email campaigns |
| Salesforce Marketing Cloud | High compatibility; real-time data can be used to personalize customer interactions |
| HubSpot | High compatibility; real-time data can be used to trigger marketing automation workflows |
Troubleshooting Real-Time Data Issues
Real-time reporting in Google Analytics provides valuable insights into website activity as it happens. However, inaccuracies or delays in real-time data can hinder the effectiveness of this feature. Understanding potential problems and troubleshooting steps is crucial for leveraging real-time data accurately.Accurate real-time data is vital for making timely decisions, such as optimizing campaigns or addressing immediate issues. Knowing how to identify and fix problems with real-time reporting is critical for effective data analysis and informed actions.
Potential Problems Affecting Real-Time Data Accuracy
Several factors can impact the accuracy and timeliness of real-time data. Network issues, high traffic volumes, and data processing limitations are common culprits. Furthermore, configuration errors within the Google Analytics setup can lead to discrepancies.

Common Real-Time Data Errors and Their Causes
Inaccurate or delayed data often stems from network problems. Slow or unreliable internet connections can cause delays in transmitting data to the Google Analytics servers. High website traffic can overwhelm the system, leading to data loss or delays. Insufficient server resources can similarly hinder real-time reporting. Incorrectly configured filters or segments can also lead to incorrect or incomplete real-time data views.
Troubleshooting Real-Time Reporting Issues
A systematic approach to troubleshooting is essential. Identifying the root cause of the problem is the first step.
Step-by-Step Troubleshooting Guide for Real-Time Data Issues
- Verify Network Connectivity: Ensure a stable and reliable internet connection for both the website and the Google Analytics account. Check for network congestion or interruptions. Testing network speed and latency can help pinpoint the problem.
- Assess Website Traffic: If experiencing delays or missing data, temporarily reducing website traffic (e.g., during off-peak hours) can help determine if high traffic volumes are a contributing factor. Observe if the real-time data improves under reduced load.
- Check Google Analytics Configuration: Verify that the Google Analytics tracking code is correctly implemented on the website. Ensure proper tagging and no errors in the configuration. Double-check that the real-time reporting feature is enabled and properly configured within your Google Analytics account.
- Examine Data Processing Limitations: Analyze the amount of data being generated by your website. High data volumes might lead to processing delays. Adjusting data sampling rates (if available) or temporarily reducing data collection can potentially improve real-time data quality.
- Review Real-Time Data Segments and Filters: Ensure that the segments and filters are correctly configured and aligned with the desired data. Incorrect filters can lead to inaccurate real-time data representations. Check if the selected filters and segments are excluding or including the necessary data points.
- Monitor Real-Time Data Reporting Tools: Use the built-in tools within Google Analytics to monitor data collection, processing, and delivery. This helps to pinpoint potential bottlenecks or errors. Analyze data refresh rates and look for any patterns in data inaccuracies or delays.
- Contact Google Analytics Support: If troubleshooting steps don’t resolve the issue, reach out to Google Analytics support. They can provide expert assistance and guidance in resolving complex problems. Consider submitting support tickets and providing detailed information about the issue.
Reasons for Missing or Delayed Real-Time Data
Missing or delayed real-time data can result from several factors, including network problems, high traffic loads, or issues with the Google Analytics setup. Sometimes, data is temporarily unavailable due to scheduled maintenance or temporary system issues. Incorrect filtering can also obscure data that would otherwise be visible.
Real-time reports in Google Analytics are super helpful for seeing how your website is performing right now. But understanding the different strategies, like A/B testing versus multiple variant testing, can significantly impact your insights. For example, if you’re trying to optimize a landing page, knowing the nuances of ab testing vs multiple variant will help you decide which approach best suits your goals.
Ultimately, real-time reports, combined with a solid understanding of different testing methodologies, give you the clearest picture of what’s working on your site in the moment.
Best Practices for Real-Time Reporting
Real-time reporting in Google Analytics offers a powerful window into user behavior as it happens. This immediacy allows for rapid responses to trends and anomalies, potentially impacting marketing campaigns and business decisions in real-time. However, effectively leveraging this data requires a structured approach and a keen understanding of interpretation. This section will Artikel best practices to ensure that real-time data is used effectively to inform informed decisions.Understanding the context of real-time data is crucial.
Real-time data reflects current events, but it doesn’t necessarily represent long-term trends. It’s essential to interpret the data within the larger framework of historical data and established patterns to avoid making decisions based on fleeting moments.
Organizing Real-Time Data for Actionable Insights
Real-time data, if not organized effectively, can quickly become overwhelming. A structured approach to collecting, processing, and visualizing real-time data is essential for extracting actionable insights. This involves identifying key performance indicators (KPIs) relevant to the business objectives and focusing data collection on those metrics. The use of dashboards and visualizations is crucial for quickly identifying patterns and anomalies.
- Define clear objectives: Before diving into real-time data, clearly define the business objectives you want to achieve with the data. For example, are you trying to optimize a specific campaign, understand customer behavior, or improve website performance?
- Select relevant KPIs: Identify the key metrics that directly relate to your objectives. This might include website traffic, conversion rates, bounce rates, or specific campaign engagement metrics.
- Utilize dashboards and visualizations: Visual representations of real-time data make it easier to identify patterns, trends, and anomalies. Use dashboards that clearly display the KPIs you’ve selected, highlighting any significant changes.
- Segment your data: Segmenting real-time data allows you to understand specific user groups or behaviors. This might involve separating data by demographics, device type, or campaign source. For example, you might analyze real-time data to identify if a specific ad campaign is driving high traffic, but low conversions, and then further segment that data to understand the user behavior that results in those conversions.
Interpreting Real-Time Data Accurately
Real-time data should not be interpreted in isolation. Understanding the context of the data and comparing it to historical data is crucial for making accurate assessments. Consider the impact of external factors, such as seasonality or current events, on the real-time trends. Look for patterns, but also be aware of potential outliers and anomalies that may not be representative of typical behavior.
- Compare with historical data: Establish baselines by examining past data. Compare real-time trends to historical averages and seasonality patterns to determine if the current data points represent a significant deviation or simply a temporary fluctuation.
- Consider external factors: Real-world events or promotions can significantly influence real-time data. For example, a major news event might drive traffic to your site, but that traffic spike may not represent sustained interest. Consider how external factors might influence the data you’re observing.
- Look for anomalies: Real-time data can reveal sudden spikes or drops in activity that may indicate problems or opportunities. Be prepared to investigate and identify the causes of such anomalies. A sudden drop in traffic may indicate a website error, a problem with a specific ad campaign, or a technical issue.
- Cross-reference with other data sources: Combine real-time data with data from other sources, such as social media monitoring or customer support tickets, to gain a more comprehensive understanding of the situation. This integrated approach provides a richer perspective on the current trends.
Implementing Real-Time Alerts
Setting up alerts for critical real-time events allows for quick responses to significant changes. These alerts can be configured based on specific KPIs or thresholds, providing immediate notification of important trends. For example, a significant drop in conversions or a sudden increase in bounce rate could trigger an alert, prompting immediate investigation and action.
- Identify critical events: Define the specific events or thresholds that require immediate attention. These might include significant increases or decreases in key metrics, such as traffic, conversions, or specific user actions.
- Configure alert criteria: Set up alerts based on specific criteria, such as predefined thresholds, or a percentage change from a baseline. For example, if the conversion rate drops by 10% within a certain timeframe, trigger an alert.
- Choose alert channels: Select appropriate channels for receiving alerts, such as email, SMS, or in-app notifications. This ensures that you receive notifications quickly and appropriately.
- Establish response protocols: Develop a clear plan for responding to alerts. This should include procedures for investigation, analysis, and action.
Closing Notes
In conclusion, real-time reports in Google Analytics are a powerful tool for understanding and responding to immediate changes in website traffic. By leveraging the insights provided by real-time data, businesses can optimize website performance, adapt to market trends, and make data-driven decisions. The key is understanding the nuances of this data, visualizing it effectively, and integrating it seamlessly with other tools to create a comprehensive view of your business performance.
This guide should equip you with the knowledge to use real-time data to its fullest potential.