Metrics in Google Analytics are the key to unlocking your website’s performance secrets. Understanding these vital data points allows you to gauge user behavior, track progress towards business goals, and ultimately, optimize your site for success. From website traffic to conversions, user engagement, and mobile performance, Google Analytics provides a comprehensive view of your online presence. This in-depth guide delves into the various metrics available, revealing how to leverage them for improved website effectiveness.
This exploration of Google Analytics metrics covers everything from basic website traffic to nuanced conversion tracking and user engagement. We’ll dissect critical KPIs, uncover the secrets of effective mobile optimization, and provide a complete picture of your audience through geographic and demographic analysis. Moreover, we’ll dive into the specific metrics crucial for e-commerce and marketing campaign success. This guide is designed to be practical, providing clear explanations and examples to empower you to leverage Google Analytics effectively.
Introduction to Google Analytics Metrics
Google Analytics is a powerful web analytics tool provided by Google that helps website owners understand how users interact with their sites. It provides a wealth of data, allowing businesses to track website traffic, user behavior, and conversions. This detailed insight is crucial for optimizing website performance and achieving business goals. Understanding user journeys, identifying areas for improvement, and measuring campaign effectiveness are all key benefits of using Google Analytics.The significance of metrics in Google Analytics lies in their ability to transform raw data into actionable insights.
By analyzing metrics, website owners can understand user behavior patterns, identify areas of website effectiveness, and ultimately make data-driven decisions to enhance their site’s performance and user experience. This knowledge allows for adjustments to content, design, and overall strategy to better meet user needs and achieve business objectives.
Common Google Analytics Metrics
A comprehensive understanding of common metrics is essential for effectively interpreting data within Google Analytics. These metrics provide a framework for evaluating website performance and user engagement. Knowing which metrics to focus on and how to interpret them will help you identify areas for improvement and optimize your website’s effectiveness.
| Metric Name | Description | Example Value | Unit of Measurement |
|---|---|---|---|
| Sessions | A single interaction with your website by a user. This includes all page views, events, and other interactions within a specific time frame (usually a session duration). | 10,000 | Count |
| Bounce Rate | The percentage of single-page sessions (i.e., sessions where users only view one page). | 40% | Percentage |
| Pages/Session | The average number of pages viewed per session. | 3.5 | Count |
| Average Session Duration | The average time spent by users on your website during a session. | 2 minutes 30 seconds | Time |
| New Users | The number of users who visited your website for the first time during a specific period. | 2,500 | Count |
| Conversion Rate | The percentage of users who complete a desired action, such as making a purchase, signing up for a newsletter, or filling out a form. | 5% | Percentage |
| Unique Visitors | The total number of distinct users who visited your website during a given period. | 5,000 | Count |
Key Performance Indicators (KPIs) in Google Analytics
Diving deeper into Google Analytics, we move beyond basic metrics to understand the true performance of your website. Key Performance Indicators (KPIs) are quantifiable metrics that track progress towards specific business objectives. Identifying and monitoring these KPIs is crucial for making data-driven decisions and optimizing website strategies.
Crucial KPIs for Website Performance
Understanding website performance requires tracking key metrics that reveal actionable insights. These metrics provide a comprehensive view of your website’s effectiveness in achieving business goals. Five crucial KPIs often tracked in Google Analytics are:
- Website Traffic: This KPI measures the total number of visitors to your website. It’s a fundamental metric for understanding the reach and visibility of your site. High website traffic often correlates with increased brand awareness and potential customer acquisition.
- Conversion Rate: This KPI assesses the percentage of website visitors who complete a desired action, such as making a purchase, filling out a form, or signing up for a newsletter. A higher conversion rate signifies improved effectiveness in driving desired user actions.
- Bounce Rate: This KPI represents the percentage of visitors who leave your website after viewing only one page. A high bounce rate might indicate that your website content isn’t engaging enough or that the landing page isn’t relevant to the user’s search.
- Average Session Duration: This KPI measures the average time visitors spend on your website during a single session. A longer average session duration indicates that visitors are finding your content valuable and engaging, contributing to higher user satisfaction and potential conversions.
- Pages per Session: This KPI indicates the average number of pages a visitor views during a single session. A higher number of pages per session suggests that visitors are exploring your website, potentially finding more information and increasing the likelihood of conversions.
KPI Table
This table summarizes the five crucial KPIs, their definitions, and associated target values. Remember that these target values are examples and should be tailored to your specific business goals and industry benchmarks.
| KPI Name | Definition | Formula (if applicable) | Target Value |
|---|---|---|---|
| Website Traffic | Total number of visitors to the website | N/A | 10,000+ unique visitors per month |
| Conversion Rate | Percentage of visitors who complete a desired action | (Conversions / Total Visitors) – 100 | 5% or higher |
| Bounce Rate | Percentage of visitors who leave after viewing only one page | (Single-page visitors / Total visitors) – 100 | 40% or lower |
| Average Session Duration | Average time visitors spend on the website per session | N/A | 3 minutes or more |
| Pages per Session | Average number of pages viewed per session | N/A | 2 or more |
Website Traffic Metrics

Website traffic metrics are crucial for understanding how users interact with your site. They provide insights into user behavior, allowing you to optimize your website for better engagement and conversions. By analyzing these metrics, you can identify areas for improvement and make data-driven decisions to enhance your website’s performance.Website traffic metrics are essential for measuring the effectiveness of your website and understanding user behavior.
Analyzing these metrics can pinpoint opportunities to optimize your site for better user engagement and conversions. This allows you to make informed decisions to improve your site’s performance.
Session Metrics
Session metrics provide a high-level overview of user interactions with your website. Sessions represent a period of time during which a user interacts with your site. Understanding session metrics helps you determine the overall volume of user activity and the duration of their visits. A longer average session duration usually indicates a more engaging website.
- Sessions: The total number of user sessions on your website. A higher number generally indicates increased user activity, but this metric should be considered alongside other factors, like bounce rate.
- Users: The total number of unique individuals who interacted with your website during a specific period. This metric helps you understand the number of distinct visitors to your site, providing a broader view of the audience.
- Average Session Duration: The average amount of time users spend on your website per session. A longer average session duration indicates that users are engaging more deeply with your content, which suggests your site is well-organized and interesting.
Bounce Rate
Bounce rate is the percentage of visitors who leave your website after viewing only one page. A high bounce rate could indicate that your website’s content or navigation is not meeting user expectations, leading to frustration and a quick exit.
- Bounce Rate: A high bounce rate suggests that users are not finding what they’re looking for on your site’s initial page, or they aren’t engaged with the content. Understanding your bounce rate in relation to other metrics is important for identifying the underlying cause.
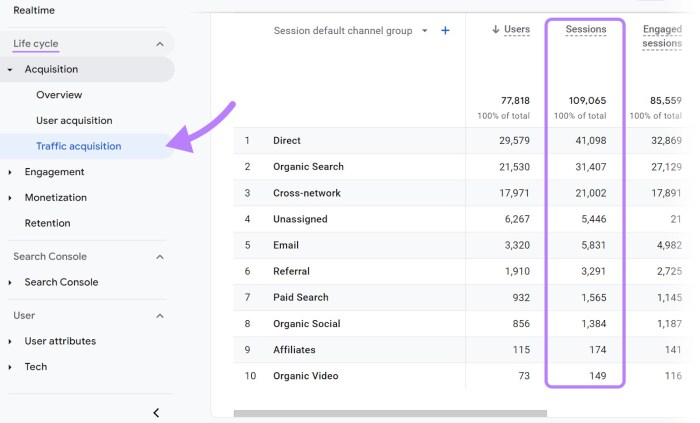
Traffic Source Comparison
Different sources of website traffic often exhibit varying user behaviors. Analyzing traffic from different sources can help you tailor your content and marketing strategies for better results.
| Traffic Source | Description | Typical User Behavior |
|---|---|---|
| Organic Search | Users who find your website through search engine results. | Often looking for specific information; more likely to stay longer and engage deeply with the site. |
| Referral Traffic | Users who arrive at your website from another website. | Often have a pre-existing interest in your site; can provide insights into partnership opportunities. |
| Social Media | Users who access your website through social media platforms. | Often looking for quick information or entertainment; engagement might be less intensive compared to organic traffic. |
Conversion Metrics
Understanding conversions is crucial for any business using Google Analytics. Conversions represent actions taken by users that directly contribute to achieving your business objectives, whether it’s a purchase, a lead form submission, or a desired interaction. Tracking these actions helps businesses understand the effectiveness of their marketing efforts and optimize strategies for better results.
Conversion Types
Different business objectives lead to different conversion types. A retail website might focus on purchases, while a SaaS company might prioritize lead generation. Understanding the specific actions that represent success is key to accurately measuring performance.
- Purchases: This is a fundamental conversion type, representing the completion of a sale. A purchase in Google Analytics can be tracked for various products or services. For example, an e-commerce store might track conversions for different product categories or variations.
- Lead Generation: Lead generation focuses on acquiring potential customers’ contact information. This often involves forms or landing pages requesting information like email addresses or phone numbers. This data allows businesses to nurture leads and convert them into paying customers.
- Form Submissions: Form submissions are a broad category encompassing various types of interactions. This can include contact forms, feedback forms, or sign-up forms for newsletters or webinars. Tracking these conversions helps understand user engagement with specific content and opportunities.
Conversion Rate
Conversion rate is a critical metric, calculated as the percentage of users who complete a desired action. A higher conversion rate indicates a more effective website or marketing campaign. A low conversion rate might signal areas needing improvement, such as website usability, call-to-action clarity, or targeted advertising. For instance, a conversion rate of 5% might indicate a well-optimized website, while a rate below 1% might suggest room for improvement.
Conversion Rate = (Conversions / Total Sessions) – 100
Conversion Paths
Conversion paths illustrate the steps users take before completing a conversion. Analyzing these paths provides insights into user journeys and pinpoints areas where users might drop off. Understanding the user experience at each step is crucial for improving conversion rates. For example, a path showing a high drop-off rate at a specific page suggests a potential issue with the design or information presented on that page.
Comparison of Conversion Types
This table Artikels different conversion types, associated metrics, and typical target values. These values are examples and can vary significantly depending on the industry and business model.
| Conversion Type | Associated Metrics | Typical Target Values |
|---|---|---|
| Purchases | Purchase value, average order value (AOV), purchase frequency | 5-15% conversion rate, $50-200 AOV |
| Lead Generation | Lead count, lead qualification rate, lead nurturing rate | 1-5% conversion rate, 30-50% lead qualification rate |
| Form Submissions | Form completion rate, form abandonment rate, form fill time | 20-40% completion rate, <5% abandonment rate, <30 seconds fill time |
User Engagement Metrics
User engagement metrics provide crucial insights into how users interact with your website. They go beyond simple traffic counts to reveal how actively and meaningfully users are engaging with your content. Understanding these metrics is vital for assessing the overall user experience and optimizing your website’s effectiveness.Understanding how users interact with your website is critical for assessing its effectiveness.
Engagement metrics offer a deeper look into user behavior, revealing valuable insights into areas where improvements can be made. This analysis allows for targeted optimization of the user experience, ultimately leading to increased conversions and improved website performance.
Defining User Engagement Metrics
User engagement metrics measure how actively and meaningfully users interact with your website. These metrics offer a more nuanced understanding of user behavior than simply tracking visits. They quantify the level of interaction and involvement users demonstrate, such as how long they spend on a page, how many pages they view, and how often they return. This allows you to gauge the quality of your website, identify areas for improvement, and ultimately optimize the user experience.
Key Engagement Metrics
Several key metrics offer insights into user engagement. They provide a comprehensive picture of how users interact with your website, from initial visit to repeated engagement.
- Pages per Session: This metric indicates the average number of pages a user views during a single session. A higher number typically suggests greater user interest and deeper exploration of your website’s content. For instance, a user who views 5 pages during a session likely has a stronger engagement with your website than a user who only views one page.
- Average Session Duration: This metric measures the average time users spend on your website during a single session. A longer average session duration indicates users are spending more time interacting with your content, suggesting a more engaging and valuable experience.
- Engagement Rate: This metric, often expressed as a percentage, reflects the proportion of users who actively engage with your website. High engagement rates suggest users are spending significant time exploring your content, indicating a positive user experience.
Connecting Engagement to Website Effectiveness
Engagement metrics are directly linked to website effectiveness. High engagement often correlates with higher conversion rates and a stronger brand perception. Users who actively engage with your content are more likely to convert into customers, demonstrating a positive response to your website’s design and content. This connection underscores the importance of optimizing user engagement for improved website performance.
Improving Website Design and User Experience
User engagement metrics can be instrumental in improving website design and user experience. By analyzing these metrics, you can identify areas for improvement. For instance, if users spend minimal time on specific pages, it might indicate issues with content clarity or accessibility. Analyzing page-by-page engagement helps to pinpoint problems and suggest solutions for enhanced user interaction.
Analyzing User Engagement Metrics: A Step-by-Step Approach, Metrics in google analytics
The following table Artikels the steps for identifying and analyzing user engagement metrics, providing a structured approach for effective website optimization.
| Step | Action |
|---|---|
| 1 | Identify Key Metrics: Determine which engagement metrics are most relevant to your website’s goals. Consider metrics like pages per session, average session duration, and bounce rate. |
| 2 | Gather Data: Collect the necessary data from Google Analytics or similar tools. Focus on specific time periods to understand trends and patterns. |
| 3 | Analyze Trends: Examine the collected data for patterns and trends in user engagement. Identify periods of high or low engagement and potential contributing factors. |
| 4 | Identify Areas for Improvement: Based on the analysis, pinpoint areas of your website that may be hindering user engagement. Consider factors like content quality, website navigation, and user interface design. |
| 5 | Implement Changes: Make necessary adjustments to your website’s design and content based on the analysis. This may involve improving navigation, enhancing content clarity, or optimizing page loading speed. |
| 6 | Monitor Results: Track the impact of the changes by monitoring the relevant engagement metrics. Evaluate whether the adjustments have led to improved user engagement. |
Mobile Metrics
Mobile devices have revolutionized how people interact with the internet. Understanding user behavior on mobile platforms is crucial for any business with a digital presence. Mobile metrics provide invaluable insights into how users navigate your website, engage with content, and ultimately, achieve your business objectives. This is why a deep dive into mobile metrics is essential.Mobile devices present unique challenges and opportunities compared to desktop usage.
Different screen sizes, touch interfaces, and varying network conditions necessitate a tailored approach to tracking and analyzing user behavior. The metrics we’ll examine below will help you understand these differences.
Importance of Mobile Metrics
Mobile metrics are vital because they reveal how users interact with your website on their smartphones and tablets. This understanding is essential for optimizing your website for mobile devices and tailoring your marketing strategies accordingly. By tracking mobile metrics, you can identify areas for improvement in the user experience, potentially increasing engagement and conversions. The insights gained can inform critical decisions, from design improvements to content adjustments.
Mobile User Experience Metrics
Understanding how users interact with your mobile site is key to optimizing its performance. Several metrics provide insight into the mobile user experience.
- Mobile Bounce Rate: The percentage of visitors who leave your website after viewing only one page. A high mobile bounce rate might indicate issues with page loading speed, irrelevant content, or a poor mobile user interface. For example, if a user lands on a product page but immediately leaves without interacting, that constitutes a mobile bounce.
- Mobile Sessions: A mobile session represents a single interaction with your website from a user’s mobile device within a specific timeframe (usually 30 minutes of inactivity). Analyzing mobile sessions helps understand the frequency and duration of user engagement on your mobile site. A low number of mobile sessions could suggest your mobile site isn’t attracting or retaining users effectively.
- Mobile Average Session Duration: This metric indicates the average time users spend on your mobile site during a session. A shorter average session duration could indicate that your mobile content isn’t engaging or that the site is difficult to navigate. Conversely, a longer average session duration suggests high engagement.
- Mobile Pages/Session: The average number of pages a user views during a mobile session. A lower number might indicate a need for improved site navigation or content organization.
Differences Between Mobile and Desktop Metrics
Mobile and desktop metrics often differ significantly. This is due to the variations in how users interact with websites on different devices.
| Metric | Desktop | Mobile | Key Differences |
|---|---|---|---|
| Bounce Rate | Reflects desktop user’s initial impression | Indicates mobile user’s initial engagement | Mobile bounce rate often higher due to shorter sessions and potential for quick exits |
| Sessions | Represents full desktop user journeys | Represents mobile user interactions | Mobile sessions are often shorter, focusing on immediate needs |
| Average Session Duration | Measures overall desktop engagement | Measures focused mobile engagement | Mobile average session duration tends to be lower due to context switching and task completion |
| Pages/Session | Reflects in-depth desktop exploration | Reflects mobile user’s need-based exploration | Mobile pages/session can be lower if users are focused on completing a specific task |
Mobile metrics provide crucial insights into user behavior on mobile devices, offering a distinct perspective from desktop metrics. By understanding and analyzing these differences, businesses can tailor their strategies to enhance the mobile user experience and achieve their marketing objectives.
Geographic and Demographic Metrics
Understanding your audience’s location and demographics is crucial for effective marketing strategies. Knowing where your users are located allows you to tailor your messaging and campaigns to resonate with specific regions. Demographic data, like age, gender, and interests, provides insights into the characteristics of your user base, enabling you to create targeted advertising and product development.Geographic and demographic insights empower businesses to refine their marketing efforts, optimize resource allocation, and enhance overall campaign performance.
This detailed understanding allows for a more precise approach to customer engagement and boosts conversion rates by directly addressing the needs and preferences of the target audience.
Importance of Geographic Data
Geographic data in Google Analytics reveals where your website visitors are located. This crucial information enables you to optimize your marketing campaigns to specific regions. For example, a company selling winter clothing might focus their advertising efforts on colder regions during the winter months. Similarly, businesses operating internationally can adjust their content and pricing based on local preferences and market conditions.
Precise geographic data allows for localized marketing strategies, maximizing campaign effectiveness.
Importance of Demographic Data
Demographic data, such as age, gender, and interests, provides valuable insights into your user base’s characteristics. This information allows businesses to understand the needs and preferences of their customers. For example, a company selling skincare products might tailor their marketing campaigns to different age groups by highlighting the specific benefits of their products for each demographic. Demographic data also enables companies to personalize their website content and offerings to enhance customer engagement.
Geographic and Demographic Metrics in Google Analytics
Google Analytics provides a comprehensive suite of metrics for analyzing geographic and demographic data. These metrics include user location, region, country, city, and more. Understanding the distribution of users across different regions and countries is vital for optimizing website content and targeting strategies. By analyzing demographic data, such as age and gender, businesses can segment their audience and personalize their marketing efforts.
Google Analytics metrics are crucial for understanding website performance. But, when it comes to creating engaging content, focusing on blog post quality over quantity is key to attracting and retaining readers, as detailed in this helpful guide on blog post quality vs quantity. Ultimately, high-quality content, measured through analytics, translates into better engagement and conversions.
So, dig deep into your Google Analytics data to see how your content strategy is working.
Examples of Geographic and Demographic Segments
| Segment | Description |
|---|---|
| Country | Visitors from specific countries. |
| Region | Visitors from specific regions within a country. |
| City | Visitors from specific cities. |
| Age | Visitors categorized by age range. |
| Gender | Visitors categorized by gender. |
| Interests | Visitors categorized by their expressed interests. |
| Technology | Visitors using specific devices or browsers. |
Understanding these segments helps businesses to tailor their marketing messages, product offerings, and website content to better meet the needs of their target audience.
Marketing Campaign Metrics: Metrics In Google Analytics
Understanding the effectiveness of your marketing campaigns is crucial for optimizing your strategies and maximizing ROI. Tracking key metrics provides insights into what’s working, what’s not, and where to allocate resources for better results. This detailed look at marketing campaign metrics will help you understand the importance of data-driven decision-making in the realm of marketing.Effective marketing campaigns are built on a foundation of data analysis.
Knowing your Google Analytics metrics is crucial for understanding blog post performance. But how do you actually use that data to boost your reach? Dive into the strategies outlined in the uncensored guide to promoting a blog post for actionable tips on maximizing engagement and ultimately, better insights in your analytics dashboards. Ultimately, those metrics will tell you exactly what’s working and what needs tweaking.
Monitoring campaign performance allows for proactive adjustments, enabling businesses to react swiftly to emerging trends and maintain a competitive edge. This data-driven approach translates into measurable improvements in campaign performance and ultimately, increased profitability.
Importance of Tracking Marketing Campaign Performance
Thorough tracking of marketing campaign performance is essential for making informed decisions about future campaigns. By monitoring key metrics, businesses can identify what resonates with their target audience and optimize their strategies accordingly. This iterative process leads to increased efficiency and a higher return on investment (ROI) from marketing efforts.
Various Metrics Used to Evaluate Marketing Campaign Success
A variety of metrics can be used to evaluate the success of marketing campaigns. These metrics provide a comprehensive view of campaign performance, allowing marketers to identify areas for improvement and make data-driven decisions. These metrics range from simple click-through rates to more complex analyses of customer behavior.
Examples of Marketing Campaign Metrics
Several specific metrics are commonly used to assess campaign effectiveness. Campaign conversion rate, for example, measures the percentage of users who complete a desired action, such as making a purchase or signing up for a newsletter, after interacting with the campaign. Another crucial metric is campaign cost per acquisition (CPA), which represents the cost incurred to acquire a new customer through a particular campaign.

These, along with other metrics, provide a comprehensive view of campaign success.
Campaign Conversion Rate
The campaign conversion rate is a critical metric that measures the percentage of users who complete a desired action after interacting with the campaign. A high conversion rate indicates that the campaign is effectively driving users to take the desired action. For example, a campaign aimed at increasing online sales might track the conversion rate of website visitors to paying customers.
Campaign Cost Per Acquisition (CPA)
The campaign cost per acquisition (CPA) represents the average cost of acquiring a new customer through a specific marketing campaign. A lower CPA indicates greater efficiency and a higher return on investment. For instance, a company running a social media campaign might track the CPA to see how much each new customer costs to acquire through that specific channel.
Comparison of Marketing Campaign Metrics
| Metric | Description | Importance ||——————-|———————————————————————————————————————————————————————————————————————————————————————————————–|—————————————————————————————————————————————————————————————————————————————————————————————————-|| Campaign Conversion Rate | Percentage of users who complete a desired action after interacting with the campaign.
| Measures effectiveness in driving desired user actions, such as purchases or lead generation.
|| Campaign Cost Per Acquisition (CPA) | Average cost of acquiring a new customer through a specific marketing campaign.
| Indicates efficiency and return on investment (ROI) for the campaign.
Lower CPA signifies better performance. || Click-Through Rate (CTR) | Percentage of users who click on a link or advertisement after seeing it.
| Useful for evaluating the effectiveness of ad campaigns and the attractiveness of calls to action.
|| Return on Ad Spend (ROAS) | Measures the revenue generated for every dollar spent on advertising.
| Crucial for assessing the profitability of advertising campaigns.
High ROAS signifies a profitable campaign. || Customer Lifetime Value (CLTV) | Predicts the total revenue a customer is expected to generate throughout their relationship with the business.
Understanding metrics in Google Analytics is crucial for event planning. Knowing how many people are visiting your event promotion pages, or what channels are driving the most traffic is essential. To get the most out of your online event promotion efforts, check out these 10 best ways promote event online, 10 best ways promote event online.
Ultimately, these insights, combined with the right data from Google Analytics, can help you optimize your strategy for maximum impact.
| Crucial for understanding the long-term value of a customer and making decisions about customer acquisition strategies.
|
E-commerce Metrics
E-commerce websites thrive on data-driven insights. Understanding key metrics is crucial for optimizing sales, improving conversion rates, and ultimately boosting profitability. This section delves into the specific metrics used to track e-commerce performance, focusing on revenue, conversion, and average order value. By analyzing these metrics, businesses can identify areas for improvement and implement strategies to maximize their online sales potential.
Specific E-commerce Metrics
E-commerce success hinges on monitoring a range of metrics. These metrics provide a comprehensive view of website performance and help pinpoint areas for improvement. From website traffic to customer behavior, each metric contributes to a complete picture of how well the e-commerce platform is functioning.
- Revenue Metrics: These metrics directly measure the financial performance of the e-commerce site. Key examples include total revenue, revenue per visitor, and revenue per product. Tracking these metrics helps understand the overall financial health of the business and identify trends in sales performance. For instance, a significant drop in revenue per visitor could signal a need to optimize the checkout process or improve product descriptions.
- Conversion Rate Metrics: These metrics measure the percentage of website visitors who complete a desired action, such as making a purchase. Essential metrics include conversion rate, conversion rate by traffic source, and cart abandonment rate. A low conversion rate might indicate issues with the website design, unclear product information, or high shipping costs. Analyzing these metrics allows for targeted improvements to boost the conversion rate.
- Average Order Value (AOV) Metrics: This metric measures the average amount spent per order. Understanding the AOV helps businesses optimize pricing strategies and product recommendations. A high AOV often indicates a strong customer relationship and potentially successful upselling or cross-selling strategies. Conversely, a low AOV may suggest the need to offer more value-added products or promotions to increase the average order amount.
Improving Sales and Profitability with E-commerce Metrics
By analyzing these metrics, e-commerce businesses can make data-driven decisions to improve sales and profitability. Understanding customer behavior and website performance allows for targeted improvements and better strategies.
- Analyzing Revenue Trends: Examining historical revenue data helps identify seasonal trends and fluctuations. This allows businesses to proactively adjust marketing strategies and inventory levels to capitalize on peak sales periods and minimize losses during slow periods.
- Optimizing Conversion Rates: Identifying areas where visitors are abandoning the purchase process (e.g., high cart abandonment rates) allows businesses to address specific issues. This might involve simplifying the checkout process, offering clear product descriptions, or implementing persuasive calls to action.
- Increasing Average Order Value: Strategies to increase AOV can include offering bundled products, recommending complementary items during the checkout process, or implementing loyalty programs that incentivize repeat purchases. A real-life example: a company might observe that customers frequently purchase specific products together and create special bundles, increasing the perceived value and the average order amount.
Key E-commerce Metrics Summary
This table summarizes key e-commerce metrics and their interpretations. Regularly tracking and analyzing these metrics is crucial for maintaining a successful e-commerce business.
| Metric | Interpretation | Example Impact |
|---|---|---|
| Total Revenue | Overall financial performance | Increased revenue suggests a successful sales strategy. |
| Conversion Rate | Percentage of visitors completing a desired action | A low conversion rate might indicate website usability issues. |
| Average Order Value (AOV) | Average amount spent per order | High AOV suggests strong customer engagement and potentially effective upselling/cross-selling. |
| Cart Abandonment Rate | Percentage of visitors who leave items in their cart without completing the purchase | High cart abandonment rate may indicate issues with the checkout process or shipping costs. |
Summary
In conclusion, mastering Google Analytics metrics is crucial for any website owner or marketer. By understanding and analyzing these metrics, you gain invaluable insights into your audience, website performance, and the effectiveness of your marketing strategies. From traffic sources to conversion rates, and from user engagement to mobile performance, this comprehensive overview equips you with the knowledge to make data-driven decisions that lead to a thriving online presence.
Remember, the key is to not just collect data, but to actively interpret and use it to improve your website and achieve your business goals.