Leading metrics for measuring success are crucial for any organization, from startups to established corporations. This guide delves into the essential aspects of defining, identifying, and utilizing these metrics to achieve your goals. We’ll explore various perspectives on success, from financial gains to customer satisfaction, and examine how to choose the right metrics for your specific context. Understanding these leading indicators is vital for making informed decisions and driving positive outcomes.
From defining success in diverse contexts to understanding the nuances of data analysis, this comprehensive guide unpacks the complexities of choosing and implementing leading metrics. We’ll also cover the importance of aligning metrics with organizational goals, ensuring they drive progress in a meaningful way. The guide explores strategies for benchmarking and visualization, providing actionable insights and actionable steps.
Defining Success Metrics
Success, a multifaceted concept, varies significantly depending on the context. In business, it might be measured by profit margins or market share. For individuals, personal success could be defined by fulfilling a personal passion or achieving a significant life goal. Even in project-based endeavors, success is tied to the project’s objectives and deliverables. A critical element in defining success is understanding the different lenses through which it can be viewed.Aligning success metrics with overarching goals is crucial.
If the company’s objective is to expand market share, then success metrics should focus on market penetration, customer acquisition, and brand awareness. Without this alignment, measuring success becomes arbitrary and may not reflect true progress toward the desired outcomes. A successful strategy will incorporate diverse perspectives to create a holistic picture.
Defining Success in Different Contexts
Success encompasses a wide range of achievements and is contingent on the context in which it’s evaluated. Different perspectives offer varying interpretations of what constitutes success.
- Business Success: This is typically measured by financial performance, such as profitability, revenue growth, and return on investment. Operational efficiency, customer satisfaction, and market share also contribute to a comprehensive understanding of business success.
- Personal Success: Personal success is often defined by individual values and aspirations. This can include achieving personal goals, building strong relationships, contributing to society, and finding fulfillment in one’s pursuits.
- Project-Based Success: Success in a project is measured by the successful completion of project objectives and deliverables within the specified timeframe and budget. Meeting quality standards and exceeding expectations are also crucial factors.
Perspectives on Measuring Success
Various perspectives are used to evaluate success. Financial, operational, and customer-centric metrics provide a comprehensive understanding of an entity’s performance.
Key metrics like website traffic and conversion rates are crucial for evaluating success in any business. However, for digital marketers, especially those aiming for high-volume campaigns, things get more nuanced. Strategies often rely on techniques like using digital marketing needs deal proxies to enhance reach and test different approaches. Ultimately, these sophisticated strategies all boil down to the same core goal: improving those key metrics that drive success.
- Financial Perspective: Financial metrics focus on profitability, revenue growth, return on investment (ROI), and cost reduction. These metrics reflect the financial health and performance of an entity. For example, a company achieving a 20% year-over-year revenue increase demonstrates strong financial success.
- Operational Perspective: Operational metrics evaluate efficiency, productivity, and process improvement. These metrics highlight the effectiveness of internal processes. An example is a manufacturing company reducing production time by 15% due to streamlined processes, indicating operational success.
- Customer-Centric Perspective: Customer-centric metrics focus on customer satisfaction, loyalty, and retention. These metrics reflect how well an entity meets customer needs and expectations. A customer satisfaction score of 90% demonstrates a high level of customer satisfaction and success in serving customers.
Aligning Success Metrics with Organizational Goals
Aligning success metrics with organizational goals ensures that measurements reflect the desired outcomes. Without this alignment, metrics can be misleading and may not accurately represent progress towards strategic objectives.
- Strategic Importance: Metrics should be directly linked to the company’s strategic objectives, enabling a clear understanding of progress toward established goals. For instance, if a company aims to increase market share, success metrics should include market penetration and brand awareness data.
- Goal-Oriented Focus: Metrics should provide insight into how well the organization is performing against its goals. By tracking progress against specific targets, the organization can identify areas requiring adjustments to meet the established goals.
Short-Term vs. Long-Term Success Metrics
The following table contrasts short-term and long-term success metrics.
| Metric Category | Short-Term | Long-Term |
|---|---|---|
| Financial | Daily/weekly sales, current month’s profit | 5-year revenue projections, long-term ROI |
| Operational | Daily production output, customer service response time | Process improvement metrics over 3 years, operational efficiency benchmarks |
| Customer-Centric | Customer satisfaction surveys this month, new customer acquisition this quarter | Customer lifetime value, customer retention rate over 5 years |
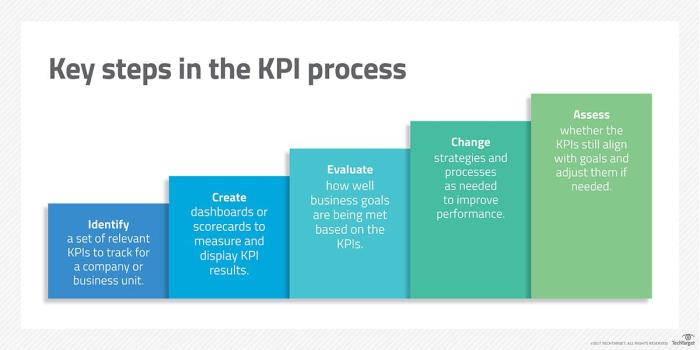
Identifying Key Performance Indicators (KPIs): Leading Metrics For Measuring Success
Defining success is crucial for any startup, but it’s equally important to have quantifiable metrics to track progress. KPIs provide a clear roadmap to success by translating qualitative goals into measurable milestones. This section delves into identifying key performance indicators (KPIs) vital for evaluating a startup’s health and trajectory.
Key Performance Indicators for Startup Success
Choosing the right KPIs is essential for a startup’s success. They must align with the company’s specific goals and provide actionable insights. A well-selected set of KPIs can illuminate areas needing improvement and highlight strategies that are driving positive results. The following KPIs, while not exhaustive, represent a robust starting point for measuring success.
Defining and Measuring Key Performance Indicators
This table Artikels a set of KPIs crucial for a hypothetical SaaS startup. These KPIs are categorized for better understanding and allow for tracking of progress across different facets of the business.
| KPI Name | Measurement Method | Target Value | Frequency of Tracking |
|---|---|---|---|
| Monthly Recurring Revenue (MRR) | Sum of all recurring revenue generated each month | $10,000 | Monthly |
| Customer Acquisition Cost (CAC) | Total marketing and sales costs divided by the number of new customers acquired | $500 | Quarterly |
| Customer Lifetime Value (CLTV) | Average revenue a customer generates over their relationship with the company | $5,000 | Annually |
| Customer Churn Rate | Percentage of customers who cancel their subscriptions each month | 5% | Monthly |
| Website Traffic | Number of unique visitors to the company’s website | 10,000 | Weekly |
| Conversion Rate | Percentage of website visitors who complete a desired action (e.g., sign up, purchase) | 10% | Weekly |
| Average Session Duration | Average time spent by a user on the website | 5 minutes | Weekly |
| Net Promoter Score (NPS) | Measure of customer satisfaction, gauged through surveys | 70 | Quarterly |
| Product Usage Rate | Percentage of users actively using the product’s core features | 80% | Monthly |
| Social Media Engagement | Number of likes, shares, comments, and followers on social media platforms | 1000+ interactions per week | Weekly |
Relationship Between KPIs
KPIs are interconnected. For example, a high customer churn rate might indicate issues with the product or customer service, potentially affecting MRR and CLTV. Conversely, a low conversion rate might point to issues with website design or marketing strategies, which in turn could impact CAC and website traffic. Understanding these interdependencies allows for a more holistic view of the startup’s performance and enables targeted interventions.
Defining leading metrics for measuring success is crucial. While exploring new tech like dynamic rendering, questions like “is dynamic rendering still worth using?” is dynamic rendering still worth using become relevant. Ultimately, however, the key to success hinges on how these advancements translate into quantifiable improvements in your core metrics, like engagement and conversion rates.
Choosing the Right Metrics
Selecting the right metrics is crucial for evaluating success in any industry. It’s not enough to just identify KPIs; you need to choose the metrics that accurately reflect the desired outcomes and provide actionable insights. This involves understanding the nuances of different industries and tailoring metrics to specific organizational goals.Effective metric selection empowers organizations to make data-driven decisions, optimize performance, and ultimately achieve their strategic objectives.
This process involves a deep understanding of the project or business, the desired outcomes, and the available resources.
Comparison of Leading Metrics Across Industries
Different industries have unique characteristics and success factors, leading to variations in the most relevant metrics. Understanding these differences is vital for selecting the right metrics.
- Retail: Key metrics in retail often focus on sales performance, customer engagement, and operational efficiency. Examples include conversion rates, average order value, customer lifetime value (CLTV), and inventory turnover. The rationale behind these metrics is to maximize revenue, minimize costs, and cultivate long-term customer relationships.
- Technology: In the tech sector, metrics frequently center around user engagement, innovation, and market share. Examples include daily active users (DAU), monthly active users (MAU), customer acquisition cost (CAC), and product adoption rates. These metrics highlight the success of product development, market penetration, and user satisfaction.
- Healthcare: Healthcare metrics prioritize patient outcomes, operational efficiency, and cost-effectiveness. Examples include patient satisfaction scores, readmission rates, average length of stay, and operational costs per patient. The focus is on providing quality care, improving patient experiences, and controlling costs.
Factors to Consider When Selecting Metrics, Leading metrics for measuring success
Choosing the right metrics for a specific project or organization involves careful consideration of various factors. Alignment with organizational goals, data availability, feasibility of measurement, and the ability to drive action are crucial elements.
- Alignment with Organizational Goals: Metrics should directly support and reflect the overarching strategic objectives of the organization or project. Misalignment can lead to wasted effort and inaccurate assessments of success.
- Data Availability and Feasibility: The chosen metrics must be measurable and attainable within the available resources and infrastructure. Realistic expectations regarding data collection and analysis are essential.
- Actionability: The selected metrics should provide actionable insights that can inform decision-making and drive improvements in performance. Metrics that lack this quality are essentially pointless.
Quantitative vs. Qualitative Metrics
A critical distinction lies between quantitative and qualitative metrics. Understanding the strengths and weaknesses of each type is essential for a comprehensive evaluation.
Tracking key metrics is crucial for any successful campaign. Knowing what’s working and what isn’t is vital for adapting your strategy. This is especially important in today’s ever-evolving digital landscape, and staying ahead of the curve requires constant adaptation. A great resource for understanding the evolving tools and techniques used by digital marketing agencies is ever evolving digital marketing agency toolkit.
Ultimately, mastering these metrics is essential for long-term success in the ever-shifting digital marketing world.
| Metric Type | Pros | Cons |
|---|---|---|
| Quantitative | Measurable, objective, easy to compare across different periods or entities. Facilitates trend analysis. | May not capture the nuances of the experience or context. Can be superficial if not interpreted properly. |
| Qualitative | Provides rich insights into the customer experience, context, and factors influencing performance. Offers a deeper understanding of customer perception. | Difficult to quantify and compare. Interpretation can be subjective. Can be more time-consuming and costly to collect. |
Data Collection and Analysis
Once you’ve defined your success metrics and KPIs, the next crucial step is gathering and analyzing the data they generate. Effective data collection isn’t just about accumulating numbers; it’s about ensuring accuracy, reliability, and the ability to extract meaningful insights. A well-structured approach to data collection and analysis will ultimately provide a clear picture of your progress towards your goals.A robust data collection and analysis strategy is paramount for gauging the effectiveness of your chosen metrics.
This involves carefully selecting appropriate methods for gathering data, ensuring its quality, and then employing the right analytical tools to extract valuable insights from the collected information.
Methods for Data Collection
Various methods are available for collecting data to track leading metrics. Choosing the appropriate method depends on the specific metric and the nature of the information needed.
- Direct Measurement: This method involves directly measuring the specific metric. For example, if your leading metric is website traffic, you would use website analytics tools to track the number of visitors. Direct measurement often provides the most accurate and reliable data.
- Surveys and Questionnaires: These methods are ideal for collecting qualitative data. For example, to understand customer satisfaction, you could send out surveys to gather feedback on their experiences. This approach provides insights into the reasons behind certain trends or behaviors.
- A/B Testing: This involves comparing two different versions of a product, feature, or campaign to see which performs better. For instance, you could test two different versions of a landing page to determine which converts more users. This method allows for a direct comparison of performance and data-driven decisions.
- CRM Systems and Databases: Customer Relationship Management (CRM) systems and databases are valuable tools for tracking customer interactions, purchase history, and other relevant data. This is essential for businesses that rely on customer interactions for their leading metrics. For instance, a CRM system can track sales leads, customer support interactions, and sales data.
Data Accuracy and Reliability
The accuracy and reliability of the data are critical to the validity of any analysis. Inaccurate or unreliable data will lead to misleading conclusions and ineffective strategies.
- Data Validation: Ensure the data collected is accurate and consistent. This includes verifying the data’s source, checking for errors, and implementing data quality controls. This step is essential to prevent inaccurate conclusions based on faulty data.
- Data Cleaning: Address inconsistencies, missing values, or outliers in the collected data. This process ensures that the data is ready for analysis and avoids skewed results. Cleaning data involves removing errors, correcting inconsistencies, and handling missing values.
- Data Security: Implement appropriate security measures to protect sensitive data. This includes access controls, encryption, and data backups to prevent unauthorized access or loss of critical information. Data security is crucial for protecting confidential information and maintaining trust.
Tools and Technologies
Numerous tools and technologies are available for data collection and analysis. Choosing the right tools depends on the specific needs and resources of the organization.
- Google Analytics: A widely used web analytics platform that provides detailed insights into website traffic, user behavior, and conversions. This platform is valuable for tracking website performance and understanding user interactions.
- Salesforce: A comprehensive CRM system that helps track customer interactions, sales activities, and marketing campaigns. This platform provides valuable insights into customer behavior and interactions.
- Tableau and Power BI: Data visualization tools that help transform raw data into meaningful insights. These tools allow for the creation of interactive dashboards and reports that provide a clear understanding of the data.
- SQL (Structured Query Language): A powerful language for managing and querying databases. SQL is crucial for extracting specific data from databases and performing complex analyses.
Interpreting Data
Interpreting data from various sources to derive meaningful insights requires careful consideration of context, trends, and patterns.
- Identifying Trends: Look for patterns and trends in the data over time. Identifying trends in data provides valuable insights into how metrics change over time.
- Comparing Data Points: Compare data points from different sources or time periods to identify correlations and causal relationships. This helps in understanding the factors influencing the metrics.
- Contextual Understanding: Consider the broader context surrounding the data. For example, if sales figures decrease, look at external factors like economic conditions or competitor activities. This ensures that conclusions are well-grounded and not misleading.
Benchmarking and Comparisons
Benchmarking is crucial for understanding how your organization’s performance stacks up against industry standards and competitors. It provides valuable insights into areas where you excel and areas that need improvement. This process isn’t just about comparing numbers; it’s about identifying best practices and adopting strategies that drive better results. Thorough benchmarking allows for data-driven decision-making, leading to enhanced performance and a competitive edge.Effective benchmarking goes beyond simply collecting data.
It involves a structured approach to analyzing and interpreting the collected information. By comparing performance across departments or teams, you can identify areas of strength and weakness, allowing for targeted improvements and optimized resource allocation. The goal is to translate benchmarking data into actionable strategies that foster growth and innovation within your organization.
Strategies for Benchmarking Leading Metrics
Benchmarking strategies involve identifying relevant industry standards or competitor data. This requires careful selection of appropriate metrics and reliable data sources. Researching industry reports, attending industry conferences, and contacting industry experts can help gather essential data. Tools such as databases or online resources can also provide valuable information. The key is to choose benchmarks that are comparable to your organization’s operations and goals.
Methods for Comparing Performance Across Departments or Teams
Comparing performance across departments or teams necessitates a consistent framework. Using standardized metrics and reporting processes is essential. Data should be collected and analyzed using consistent methodologies across all departments. This ensures that comparisons are fair and meaningful. A clear definition of success for each department or team, aligned with overall organizational goals, is crucial for appropriate benchmarking.
For example, a marketing team’s success might be measured by lead generation, while a sales team’s success might be measured by conversion rates.
Presenting Benchmarking Data
Presenting benchmarking data effectively is crucial for drawing actionable insights. Tables and charts can clearly display performance comparisons. For instance, a table showing the average conversion rate for different sales teams alongside industry benchmarks can visually highlight performance discrepancies. Charts, such as bar charts or line graphs, can illustrate trends over time, facilitating a more comprehensive understanding of performance patterns.

The use of color-coding or other visual cues can further enhance data interpretation.
- A table can effectively compare sales figures across different regions, highlighting areas where performance excels or lags behind industry averages. This tabular representation aids in identifying potential growth opportunities and areas requiring attention.
- Line graphs can showcase the trend of key performance indicators (KPIs) over time. This allows for the identification of seasonal variations or long-term performance patterns. For example, a line graph plotting customer satisfaction scores over a year can reveal patterns and trends in customer sentiment.
Impact of Using Industry Benchmarks
Using industry benchmarks enables organizations to pinpoint areas for improvement. By comparing performance to industry averages, gaps in performance become evident. This clarity is essential for identifying strategies to enhance processes and achieve better results. For instance, if a company’s customer satisfaction scores are below industry benchmarks, it can initiate programs to improve customer interactions and increase satisfaction levels.
| Metric | Company A | Industry Benchmark | Difference |
|---|---|---|---|
| Customer Acquisition Cost (CAC) | $150 | $125 | $25 higher |
| Customer Lifetime Value (CLTV) | $500 | $600 | $100 lower |
This table illustrates how benchmarking data can highlight performance differences. Company A’s CAC is higher than the industry average, while its CLTV is lower. This information allows for strategic adjustments to address these performance gaps.
Visualizing Leading Metrics
Turning raw data into actionable insights is crucial for success. Visualizing leading metrics allows for quick identification of trends, patterns, and potential issues, empowering data-driven decision-making. Effective visualizations transform complex datasets into easily digestible information, facilitating better understanding and communication across teams.Visualizations are not just pretty pictures; they are powerful tools for understanding performance and identifying areas needing improvement.
Clear and concise visualizations ensure everyone, from executives to front-line employees, can grasp the key takeaways and contribute to achieving common goals.
Effective Chart and Graph Types
Visualizations should be chosen based on the specific metric and the insights you want to extract. Different chart types excel at highlighting different aspects of the data. For example, line graphs are excellent for tracking trends over time, while bar charts are ideal for comparing different categories. Pie charts effectively represent proportions and percentages.
- Line Graphs: Ideal for showcasing trends over time, highlighting changes in a metric over periods. They effectively reveal growth, decline, or stability. For instance, visualizing monthly sales figures over a year demonstrates clear patterns of seasonality or growth.
- Bar Charts: Excellent for comparing different categories or groups. For example, visualizing sales figures by product line allows for direct comparisons and identification of high-performing products.
- Pie Charts: Useful for displaying proportions or percentages within a whole. Representing the distribution of marketing spend across different channels provides a clear picture of the allocation.
- Scatter Plots: Highlight relationships between two variables. For example, examining the correlation between customer acquisition cost and customer lifetime value can identify areas for optimization.
Creating a Sample Dashboard
A well-designed dashboard consolidates key metrics into a single, interactive view. It allows for real-time monitoring and provides a comprehensive overview of performance.
| Metric | Visualization | Description |
|---|---|---|
| Monthly Revenue | Line Graph | Tracks revenue growth or decline over time, highlighting trends. |
| Customer Acquisition Cost (CAC) | Bar Chart | Compares CAC across different marketing channels, enabling identification of cost-effective channels. |
| Customer Lifetime Value (CLTV) | Scatter Plot | Shows the relationship between CAC and CLTV, aiding in identifying optimal strategies. |
| Website Traffic | Line Graph | Tracks website traffic over time, identifying seasonal peaks and dips. |
Identifying Trends and Patterns
Visual representations make it easier to spot trends and patterns in the data. By visually examining the visualizations, you can identify seasonal fluctuations, emerging patterns, and potential outliers.
- Identifying Trends: Line graphs can clearly demonstrate upward or downward trends in key metrics over time. For example, a consistently rising line graph for website traffic indicates positive growth.
- Recognizing Patterns: Analyzing charts and graphs can reveal patterns that might not be immediately apparent in raw data. A cyclical pattern in sales data, for instance, could signal the need for seasonal marketing campaigns.
- Spotting Outliers: Visualizations can highlight unusual data points or outliers that might require further investigation. A sudden spike in customer complaints, for example, warrants immediate attention.
Interpreting and Acting on Data
Turning raw data into actionable insights is crucial for any organization aiming to achieve its goals. Understanding trends and patterns in leading metrics allows for proactive adjustments and ultimately, improved performance. This section delves into the process of interpreting data, identifying areas for improvement, and creating actionable plans to capitalize on the insights gained.Data interpretation isn’t simply about observing numbers; it’s about understanding thewhy* behind the trends.
A seemingly insignificant dip in sales could stem from a marketing campaign’s underperformance, a competitor’s new product launch, or even a temporary economic downturn. A comprehensive analysis, considering various factors, is essential for accurate interpretation.
Interpreting Data Trends and Patterns
Effective data interpretation requires a structured approach. Identify key patterns in the collected data. Are there seasonal fluctuations? Are certain marketing strategies yielding better results than others? By recognizing recurring patterns, organizations can anticipate future performance and adapt strategies accordingly.
Consider using tools like trend lines and seasonality analysis to visually represent patterns and quantify their impact. For example, a steady upward trend in website traffic over several months might indicate a successful strategy.
Identifying Areas for Improvement
Data analysis can highlight areas needing attention. If sales figures for a specific product line consistently fall below target, a deeper investigation is warranted. Possible reasons include pricing issues, inadequate marketing efforts, or problems with the product itself. Analyzing leading metrics alongside other relevant data sources, such as customer feedback or market research, provides a more complete picture of the underlying issues.
Creating Action Plans
Developing actionable plans based on the insights gained from the data is vital. A structured approach ensures clarity and accountability.
- Define Specific Goals: Clearly articulate the desired outcomes. For instance, “Increase sales of product X by 15% in the next quarter.” This focused objective provides a benchmark for measuring success.
- Identify Root Causes: Don’t just identify problems; delve into the reasons behind them. If customer satisfaction scores are low, understand the specific factors contributing to this issue. Is it poor customer service, confusing product information, or long wait times? This step is critical for effective solutions.
- Develop Actionable Strategies: Based on the identified root causes, create practical steps to address them. For example, if customer service is the issue, implement training programs for customer service representatives or streamline the support process. Strategies should be measurable and have specific timelines.
- Assign Responsibilities and Set Deadlines: Delegate tasks to specific individuals and set realistic deadlines. This ensures accountability and a clear understanding of expectations. Regular check-ins and progress reports are crucial for monitoring the implementation of the action plan.
- Monitor and Evaluate Progress: Continuously track the impact of the implemented strategies against the defined goals. Use the same leading metrics to monitor progress. Regular reviews and adjustments are essential for adapting to changes and maintaining momentum.
Importance of Taking Action
Ignoring data insights can lead to missed opportunities and stagnation. Proactive responses to data-driven findings are key to achieving organizational goals. For instance, identifying a trend of declining customer satisfaction early allows for corrective actions to be taken before the problem escalates.
Example of Action Plan
| Goal | Root Cause | Action Strategy | Responsibility | Deadline |
|---|---|---|---|---|
| Increase website traffic by 10% | Low organic search rankings | Optimize website content for relevant s, build high-quality backlinks | Team | Q3 2024 |
This structured approach, by incorporating data-driven action plans, will result in more efficient use of resources and ultimately contribute to achieving organizational objectives.
Final Summary

In conclusion, effectively measuring success relies on a robust understanding of leading metrics. This guide has provided a framework for defining success, identifying key performance indicators, and utilizing data to drive positive change. By carefully selecting and tracking relevant metrics, organizations can gain a clearer understanding of their progress and make informed decisions to achieve their goals. Remember, the key is alignment, consistency, and a willingness to adapt and refine your approach based on the insights gained.