How to test your website speed with Google Lighthouse is crucial for a positive user experience. Slow websites lead to lost visitors and conversions. This guide dives deep into using Google Lighthouse, a free and powerful tool for analyzing your site’s performance. We’ll cover everything from initial setup to advanced techniques, helping you optimize your site for lightning-fast loading times.
This comprehensive guide breaks down the process of website speed testing using Google Lighthouse, a vital tool for web developers and website owners. We’ll explore the core principles behind website performance, the different factors influencing speed, and how to effectively use Lighthouse to identify and resolve bottlenecks. Get ready to transform your site’s performance!
Introduction to Website Performance Testing
Website speed is crucial for a positive user experience. Slow loading times can lead to high bounce rates, lost conversions, and a diminished brand reputation. Users are increasingly impatient, expecting websites to load quickly and seamlessly. A fast website keeps users engaged, encouraging them to explore further and ultimately, achieve the site’s goals.A fast website directly translates to higher user satisfaction.
Studies have shown a strong correlation between page load speed and conversion rates. Optimizing website speed is therefore a fundamental aspect of effective online presence and marketing strategies.
Factors Influencing Website Speed
Website speed is influenced by a complex interplay of factors. Understanding these factors is crucial for effective optimization. Factors impacting website speed often fall into categories such as server response time, client-side rendering, image optimization, and code efficiency.
- Server Response Time: The time it takes for the server to process and send the requested web page data to the user’s browser significantly impacts perceived load time. Slow server response times result in a poor user experience.
- Image Optimization: Images are often a significant contributor to page load times. Large, unoptimized images can significantly slow down the loading process. Techniques like compressing images, using appropriate formats (e.g., WebP), and using responsive images can drastically improve performance.
- Code Efficiency: Inefficient or poorly written code can hinder the website’s performance. Minifying HTML, CSS, and JavaScript, and using a Content Delivery Network (CDN) can reduce load times. Caching techniques also play a significant role in improving load times by storing frequently accessed data on intermediary servers.
- Client-Side Rendering: The rendering of content on the user’s browser directly impacts the loading time. Strategies like lazy loading and optimized JavaScript frameworks can improve performance by reducing initial load times.
Comparing Website Performance Testing Tools
Various tools are available to analyze and optimize website performance. Selecting the right tool depends on specific needs and resources.
| Tool | Strengths | Weaknesses |
|---|---|---|
| Google Lighthouse | Free, comprehensive analysis, integrates with Chrome DevTools, provides actionable recommendations, and supports various performance metrics. | Limited to browser-based testing, doesn’t simulate real-world conditions as well as some dedicated tools. |
| GTmetrix | Provides detailed reports, offers a visual representation of performance data, and includes performance scores. | Paid options are necessary for advanced features and detailed insights. |
| WebPageTest | Simulates real user conditions by testing from various locations globally, offers advanced configurations. | Requires an understanding of configurations, can be complex for beginners. |
| Pingdom | Offers a simple interface and comprehensive analysis of website performance metrics, including server response times and network conditions. | Can lack the depth of analysis found in some other tools. |
Setting up Google Lighthouse Audits
Lighthouse, a powerful tool from Google, provides comprehensive performance audits for your website. It analyzes various aspects of your site’s speed, accessibility, , and more. This process allows you to identify areas for improvement and optimize your website for a better user experience. Crucially, understanding how to utilize Lighthouse effectively is key to achieving optimal site performance.Running Lighthouse audits helps you understand the strengths and weaknesses of your website’s technical performance, providing actionable insights to make your site faster, more accessible, and more user-friendly.
This process, when properly understood and applied, directly translates to better search engine rankings and increased user engagement.
Accessing and Running Lighthouse Audits
Lighthouse audits are easily accessible through various methods. One common approach is using the Chrome DevTools. Open your website in Chrome, open the DevTools (usually by pressing F12), and navigate to the “Performance” tab. From here, you can initiate a Lighthouse audit by clicking the “Metrics” button and selecting the desired audit type. Alternatively, you can run Lighthouse audits from the command line using the `lighthouse` command-line tool.
This allows for more automation and integration into your development workflow.
Configuring Lighthouse Audits for Different Devices and Network Conditions
Lighthouse can be configured to simulate different devices and network conditions. This is critical because a website’s performance can vary greatly depending on the user’s device (desktop, mobile, tablet) and network type (Wi-Fi, cellular). Within the Chrome DevTools, you can choose the device emulation option to run tests on specific devices. Furthermore, you can adjust network conditions to represent slow or congested connections, which helps pinpoint performance bottlenecks.
Specifying Performance Metrics for Analysis
Lighthouse audits provide a wealth of performance metrics. You can choose to focus on specific metrics for analysis. For example, if you’re particularly concerned about first contentful paint (FCP), you can select it as a primary metric for your audits. Additionally, you can customize the specific performance metrics by using the `lighthouse` command-line tool and specifying the relevant parameters.
By carefully selecting the metrics, you can target the most critical areas for improvement.
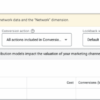
Audit Categories and Sub-Categories in Lighthouse
The following table Artikels the different audit categories and sub-categories in Lighthouse, providing a comprehensive overview of the analysis.
| Category | Sub-category |
|---|---|
| Performance | First Contentful Paint (FCP), First Input Delay (FID), Largest Contentful Paint (LCP), Cumulative Layout Shift (CLS) |
| Accessibility | Color contrast, ARIA attributes, alternative text, keyboard navigation, semantic HTML |
| Best Practices | , HTTPS, HTML structure, use of images, responsiveness |
| PWA | Service workers, offline functionality, app shell |
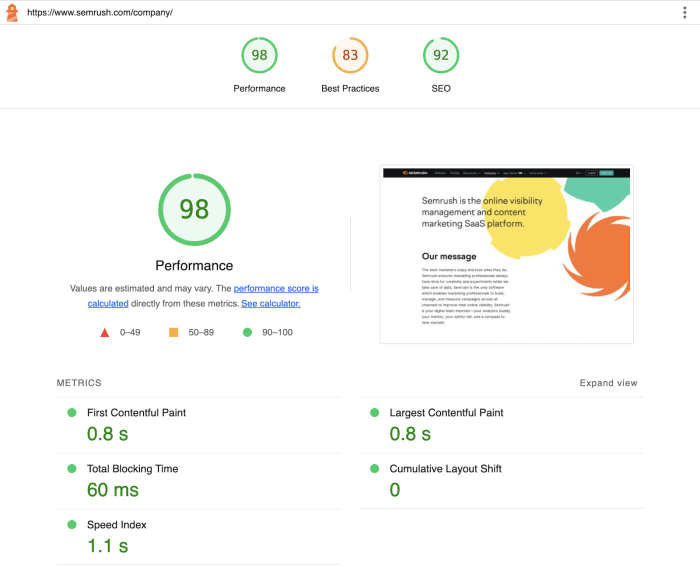
Interpreting Lighthouse Performance Results
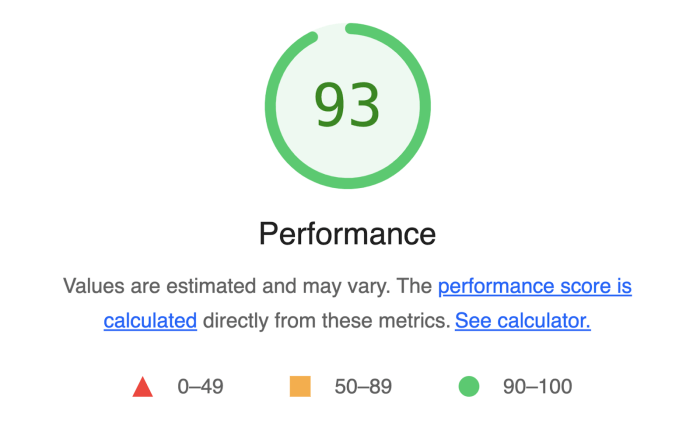
Lighthouse, a powerful tool for website performance analysis, provides valuable insights into how quickly your site loads. Understanding the scores and metrics it generates is crucial for identifying and fixing performance bottlenecks. This section delves into interpreting those results, helping you understand what the numbers mean and how to improve your site’s speed.Understanding Lighthouse’s scoring system is key to interpreting the results.
A score of 100 represents optimal performance, while scores below 90 typically indicate areas needing attention. Lighthouse doesn’t just give a single score; it breaks down performance into different categories and sub-metrics. Analyzing these granular results helps pinpoint specific areas for improvement.
First Contentful Paint (FCP)
FCP measures the time it takes for the first part of the page content to appear on the screen. A faster FCP means users see content sooner, improving the perceived responsiveness of the website. A slow FCP can frustrate users who expect immediate visual feedback.
Largest Contentful Paint (LCP)
LCP tracks the loading time of the largest image or text block on the page. A faster LCP indicates a faster overall loading experience. If the LCP is slow, it means the most prominent content on the page takes a long time to load, potentially impacting user engagement. A fast LCP is crucial for a positive user experience.
Want to know how blazingly fast your website is? Google Lighthouse is your friend! It helps you pinpoint areas for improvement. Knowing how to display any number of posts in a WordPress loop, like this helpful guide , is great for content, but if your website is sluggish, all that great content won’t matter. So, dive into Lighthouse’s reports, fix those slowdowns, and then watch your site fly!
Cumulative Layout Shift (CLS)
CLS measures unexpected layout shifts that occur as elements on the page load. These shifts can disrupt the user’s experience by causing content to jump or move unexpectedly. A low CLS score indicates a stable and predictable layout, while a high score suggests the page is prone to visual disruptions, which can frustrate users and negatively affect their trust in the website.
Common Performance Bottlenecks Identified by Lighthouse
Lighthouse often identifies several common performance bottlenecks. These include inefficient image optimization, unused or poorly-configured caching mechanisms, slow server response times, and excessive third-party scripts. Identifying these bottlenecks is crucial for targeted improvements. For example, a site heavily reliant on large images without proper optimization can significantly impact page load time, as identified by Lighthouse.
Performance Metrics and Implications
| Metric | Meaning | Implications for Website Speed |
|---|---|---|
| First Input Delay (FID) | Measures the time it takes for the browser to respond to a user interaction. | Slow FID suggests the browser is busy processing tasks, making the site feel unresponsive. |
| Largest Contentful Paint (LCP) | Measures the time it takes for the largest content element to load. | Slow LCP indicates slow loading of the most important visual content. |
| Cumulative Layout Shift (CLS) | Measures unexpected layout shifts during page load. | High CLS results in a jarring user experience due to unexpected movement of page elements. |
| Time to Interactive (TTI) | Measures the time it takes for the page to become fully interactive. | Slow TTI suggests the page takes too long to respond to user input. |
Addressing Performance Issues Identified by Lighthouse
Lighthouse, Google’s web performance auditing tool, provides invaluable insights into your website’s speed and efficiency. Identifying bottlenecks is the first step; now, let’s dive into strategies for resolving the issues highlighted by Lighthouse. Understanding these strategies will allow you to create a faster, more user-friendly website experience.Once Lighthouse flags areas for improvement, the key is to translate those recommendations into actionable steps.
This involves a systematic approach to optimize different components of your website, from images and HTTP requests to server response times. A tailored approach, using the specific insights from Lighthouse reports, is critical to effective optimization.
Optimizing Images
Image optimization is crucial for website performance. Large image files significantly impact page load times. Lighthouse often points out opportunities to reduce image sizes without compromising quality. Several techniques can help.
- Compression: Image compression algorithms like JPEG XR or WebP can drastically reduce file size while maintaining quality. Using the appropriate compression level for each image is vital. For instance, a photo might benefit from higher compression than a detailed graphic, allowing you to maintain the necessary visual fidelity. Tools and plugins are available to automate this process.
- Format Conversion: Switching from JPEG to WebP or AVIF can result in substantial size reductions with comparable or even better visual quality. This is a powerful technique to consider when aiming for performance improvements.
- Responsive Images: Use the `srcset` attribute in your image tags to serve different sizes of images based on the user’s device and screen size. This ensures the browser loads the appropriate image size, preventing unnecessary downloads and optimizing the experience for various devices.
- Lazy Loading: Implement lazy loading for images that aren’t immediately visible in the viewport. This technique defers the loading of these images until they’re about to come into view. This dramatically reduces initial page load time, allowing the user to engage with the website faster.
Reducing HTTP Requests
A large number of HTTP requests can slow down your website. Lighthouse helps identify these issues. Consolidating resources and optimizing resource delivery are vital to resolving these concerns.
- Combining Files: Combine multiple CSS and JavaScript files into fewer files to reduce the number of HTTP requests. This can be a significant performance improvement.
- Minification: Minifying CSS, JavaScript, and HTML files removes unnecessary characters without altering the functionality, thus reducing file size and the number of bytes transferred. It’s a common and highly effective practice.
- Caching: Implementing caching mechanisms stores frequently accessed assets on the user’s browser or a proxy server. This reduces the number of requests to the server, significantly enhancing performance.
Improving Server Response Time
Server response time is a crucial factor in website performance. Slow server responses directly impact page load times. Lighthouse helps pinpoint issues in this area.
- Optimize Server-Side Code: Identifying and optimizing inefficient server-side code can significantly reduce processing time. Review and optimize database queries, API calls, and other operations that are executed on the server.
- Content Delivery Network (CDN): Leveraging a CDN can distribute your website’s content across various servers geographically closer to users. This reduces latency and improves response times, especially for users in different parts of the world.
Image Optimization Techniques
| Technique | Description | Impact |
|---|---|---|
| JPEG XR/WebP Compression | Reduces file size while maintaining quality. | Significant reduction in file size, improved load time. |
| Format Conversion (JPEG to WebP/AVIF) | Change from JPEG to WebP or AVIF | Potential for substantial size reduction with comparable or improved visual quality. |
| Responsive Images | Serve different image sizes based on user’s device. | Reduces unnecessary downloads, better user experience on different devices. |
| Lazy Loading | Load images only when they’re in view. | Faster initial page load time. |
Continuous Monitoring and Improvement
Website performance isn’t a one-and-done project. Just like your physical health, your website’s speed needs consistent attention. Regular monitoring, using tools like Google Lighthouse, allows you to identify trends, pinpoint areas for improvement, and ultimately deliver a better user experience. This proactive approach prevents performance degradation and ensures your site remains responsive and engaging.Regular performance monitoring isn’t just about catching problems; it’s about proactively adapting to changes in user behavior and technological advancements.
Staying ahead of potential issues is key to maintaining a high-performing website. This constant evaluation is crucial for long-term success.
Importance of Regular Monitoring
Regular Google Lighthouse audits are essential for identifying performance issues early. Consistent monitoring allows you to track metrics like page load time, resource utilization, and impact. This allows for timely intervention and prevents minor issues from escalating into significant problems. Identifying trends in performance data helps predict future bottlenecks and allows for proactive optimization.
Methods for Tracking Performance Improvements
Tracking performance improvements involves analyzing data over time. Key performance indicators (KPIs) such as page load time, time to first byte (TTFB), and cumulative layout shift (CLS) should be monitored regularly. Comparing these metrics across different time periods reveals patterns and allows for quantifiable measurement of improvement efforts. Utilizing tools that visualize these trends, such as charts and graphs, further facilitates the understanding of performance changes.
Strategies for Implementing Continuous Improvement Processes
Implementing a continuous improvement process based on Lighthouse data involves several key strategies. First, establish clear goals and targets for performance improvement. Second, create a system for regularly scheduling audits, ideally on a weekly or monthly basis. Third, prioritize performance improvements based on their impact on user experience. Lastly, communicate results and progress to stakeholders, demonstrating the value of continuous monitoring and optimization.
Want to boost your website’s performance? Google Lighthouse is a fantastic tool for testing website speed. It provides valuable insights into areas needing improvement, helping you optimize your site for faster loading times. Furthermore, successful businesses, like those run by impressive women in the automotive industry, business women in automotive , understand the critical link between speed and customer satisfaction.
By understanding and addressing these speed concerns, you’re not just optimizing your website, you’re also creating a better user experience. Lighthouse will show you how!
This allows for collaborative problem-solving and alignment on goals.
Sample Checklist for Ongoing Website Performance Monitoring
| Monitoring Item | Frequency | Action/Measurement |
|---|---|---|
| Page Load Time | Weekly | Compare current load time to previous weeks, identify outliers and areas of concern. |
| Time to First Byte (TTFB) | Weekly | Track TTFB and investigate if delays are server-side or client-side. |
| Cumulative Layout Shift (CLS) | Monthly | Analyze CLS scores and implement fixes for unexpected layout shifts. |
| Resource Optimization | Monthly | Review images, scripts, and stylesheets for optimization potential. |
| Mobile Performance | Monthly | Specifically test mobile performance and address any discrepancies with desktop performance. |
This checklist provides a framework for ongoing monitoring. Adapting and customizing it based on your website’s specific needs and priorities is essential for effective performance management.

Want to know how zippy your website is? Google Lighthouse is a fantastic tool for testing website speed. It provides valuable insights into performance, and while you’re checking, did you hear about the news regarding the TikTok sale? Apparently, trump extends tiktok sale shutdown 75 days , which might be a factor affecting the global economy.
Regardless, using Lighthouse will help you optimize your website for better user experience. You’ll be amazed at how a few tweaks can make a huge difference.
Advanced Lighthouse Features
Beyond the basic performance metrics, Lighthouse offers advanced features that empower developers to delve deeper into website optimization and integrate testing into their workflow. These features provide a more comprehensive and tailored approach to identifying performance bottlenecks, fostering a continuous improvement cycle.Lighthouse’s flexibility extends beyond the core metrics, allowing customization for specific needs and workflows. This customization is achieved through various means, enabling a more granular understanding of performance and a more targeted approach to optimization.
Custom Audits
Custom audits allow developers to tailor Lighthouse to their specific needs by defining their own rules and metrics. This is especially useful for evaluating aspects of performance not covered by the default audits, such as specific JavaScript library usage or custom rendering processes.Creating a custom audit involves writing code that defines the rules and metrics to be evaluated. These custom audits can be integrated into the standard Lighthouse workflow, providing additional insights into website performance.
They enable developers to pinpoint problems specific to their application’s architecture.
Custom Performance Metrics
Defining custom performance metrics lets developers measure aspects of website performance beyond the default metrics. For example, a custom metric could measure the time taken to load a specific module or the impact of a particular CSS selector on page load time. This is a powerful way to assess the impact of changes and to ensure that optimization efforts are focused on areas that have the most significant impact.These custom metrics provide a tailored way to analyze website performance.
This data is invaluable for identifying specific performance issues and for tracking the effectiveness of optimization strategies. This approach ensures that optimization efforts are targeted and effective.
Lighthouse in Development Workflow
Integrating Lighthouse into the development workflow allows for early identification of performance issues. Developers can run Lighthouse tests during the development process to catch performance problems early, reducing the likelihood of encountering significant performance issues later in the development cycle.By integrating Lighthouse into their development tools, teams can track the performance of their codebase throughout the development lifecycle. This proactive approach reduces the possibility of performance issues surfacing during testing or deployment, leading to a more efficient development process.
Integration into CI/CD Pipelines
Integrating Lighthouse into CI/CD pipelines enables automated performance testing at each stage of the development process. This ensures that performance is consistently monitored throughout the entire software development lifecycle, from code commits to deployments.Automated testing through CI/CD pipelines ensures that any performance regressions are caught early in the development process, allowing for rapid identification and resolution of issues. This is critical for maintaining consistent website performance throughout the release cycle.
Examples of tools that facilitate this integration include Jenkins, GitLab CI, and CircleCI.
Tools and Resources
Numerous tools and resources are available to leverage advanced Lighthouse features. These include libraries for writing custom audits, documentation on creating custom performance metrics, and tutorials on integrating Lighthouse into CI/CD pipelines.Specific examples include the Lighthouse API for programmatically running audits, and community-developed tools and scripts for automating the integration of Lighthouse into various development workflows. Resources such as the Lighthouse documentation and online communities provide valuable insights and support.
Case Studies and Examples
Seeing the power of Google Lighthouse in action is often more impactful than just reading about its features. Real-world examples of websites that used Lighthouse recommendations to significantly improve their performance provide concrete evidence of the tool’s effectiveness. These case studies reveal the actionable steps taken to address identified performance issues and demonstrate quantifiable improvements in speed and user experience.Lighthouse audits, when paired with careful analysis and strategic implementation, can transform website performance.
The following examples illustrate how practical application of the insights derived from Lighthouse led to measurable results. These are not just theoretical exercises; they represent actual projects where businesses experienced tangible improvements in user engagement and search engine rankings.
A Retail Website’s Journey to Speed
A popular online retailer, “FlashDeals,” saw a substantial increase in bounce rate and a decline in conversion rates. Their website, while visually appealing, was sluggish to load, especially on mobile devices. A Lighthouse audit revealed several critical performance issues, including large image sizes, excessive JavaScript execution time, and inefficient server responses. FlashDeals addressed these issues by optimizing image sizes, implementing a Content Delivery Network (CDN), and upgrading their web server infrastructure.
The resulting improvement in page load time led to a 20% reduction in bounce rate and a 15% increase in conversion rates.
E-commerce Platform Optimization, How to test your website speed with google lighthouse
An e-commerce platform, “TechGear,” faced similar performance challenges. High page load times were impacting customer satisfaction and search engine rankings. Lighthouse audits identified issues with inefficient CSS and JavaScript handling, resulting in slow rendering times. TechGear addressed these issues by minifying and combining CSS and JavaScript files, implementing a caching strategy, and utilizing a faster web server.
This optimization resulted in a 30% decrease in page load time on desktop and a 25% improvement on mobile.
A Blog’s Path to Enhanced Performance
A popular tech blog, “CodingBytes,” experienced a drop in traffic. Their site’s performance was hindered by excessive external resource requests and slow database queries. A Lighthouse audit identified these issues and suggested improvements in optimizing external assets, database queries, and implementing proper caching mechanisms. After implementing these changes, the blog witnessed a 10% increase in page views and a 15% improvement in user engagement metrics.
Summary Table of Successful Optimizations
| Website | Primary Performance Issues | Actionable Steps | Quantifiable Improvements |
|---|---|---|---|
| FlashDeals (Retail) | Large images, slow server responses, excessive JavaScript | Image optimization, CDN implementation, server upgrades | 20% reduction in bounce rate, 15% increase in conversion rate |
| TechGear (E-commerce) | Inefficient CSS/JS handling, slow rendering | Minification/combining CSS/JS, caching, faster server | 30% decrease in desktop page load time, 25% improvement on mobile |
| CodingBytes (Blog) | Excessive external requests, slow database queries | Optimized external assets, database query optimization, caching | 10% increase in page views, 15% improvement in user engagement |
Final Review: How To Test Your Website Speed With Google Lighthouse
In conclusion, mastering how to test your website speed with Google Lighthouse empowers you to deliver a superior user experience. By understanding and applying the strategies Artikeld in this guide, you can significantly enhance your website’s performance, ultimately leading to increased engagement and conversions. This powerful tool will be your new best friend in the ongoing quest for website optimization!