Google Analytics scroll depth sets the stage for understanding how users interact with your website. This deep dive explores how far users scroll, revealing crucial insights into user engagement and content effectiveness. We’ll examine various measurement methods, practical applications for website improvement, and how to implement and interpret scroll depth data to optimize content, enhance user experience, and boost conversion rates.
By understanding user scrolling behavior, you can tailor your website’s design and content to better resonate with your audience, leading to a more engaging and ultimately successful online presence. Let’s embark on this journey of discovery.
Defining Scroll Depth
Scroll depth in Google Analytics provides valuable insights into user engagement with web pages. It measures how far down a page users scroll, offering a nuanced understanding of user interaction beyond simple page views. This metric helps website owners identify areas where content might be engaging or where users are dropping off. Understanding scroll depth is crucial for optimizing content and enhancing the overall user experience.Scroll depth is a key performance indicator (KPI) that quantifies the level of user engagement with webpage content.
Google Analytics scroll depth is a great way to track user engagement, but optimizing images for web design is crucial for a smooth user experience and ultimately affecting those scroll depth metrics. A well-optimized image, like those you can learn about at optimize images web design , loads quickly and doesn’t hinder page load times, allowing users to scroll further down your website.
This improved performance positively impacts your Google Analytics scroll depth data, showcasing how crucial image optimization is to user engagement.
By tracking how far down a page visitors scroll, businesses can gain valuable information about their audience’s interest in various sections. This data can then be used to improve content organization, design, and overall user experience. This information is vital for making data-driven decisions to optimize web pages for better engagement and conversion rates.
Scroll Depth Measurement Methods
Different methods exist for measuring scroll depth, each with its own strengths and limitations. The choice of method often depends on the specific goals and resources of the website. Understanding these variations allows for a more informed selection for accurate analysis.
| Method | Description | Advantages | Disadvantages |
|---|---|---|---|
| Pixel-Based Measurement | This method tracks the vertical scroll position in pixels. It’s straightforward to implement and understand. | Easy to implement, provides precise scroll depth data, relatively inexpensive to track. | Can be less accurate in representing user engagement, especially on pages with complex layouts. Can be affected by screen size variations, and doesn’t consider user intent or motivation for scrolling. |
| Percentage-Based Measurement | This method calculates scroll depth as a percentage of the total page height. It’s more user-friendly and allows for easier comparison across different pages. | Easy to interpret and compare, more readily applicable to different page layouts, less affected by screen size variations. | Less precise in capturing specific scroll depths. Doesn’t account for variations in content density or layout, and may not be accurate in reflecting the engagement level with specific elements on the page. |
| Section-Based Measurement | This method divides the page into sections and measures how many sections a user scrolls through. This method allows for a focus on specific content engagement. | Offers a granular view of user engagement with specific content blocks, allows for tracking of engagement with different sections of the page. | Requires careful definition of sections and can be complex to implement. Does not always correlate well with overall engagement, as users may scroll through a section without engaging with the content. |
Different scroll depth measurement methods provide varied insights. Pixel-based methods offer precise data but can be less intuitive. Percentage-based approaches are more straightforward but might lose some precision. Section-based measurements focus on engagement with specific content blocks but need careful section definition. The selection of the best approach depends on the specific goals and context of the analysis.
Practical Applications of Scroll Depth: Google Analytics Scroll Depth
Scroll depth data, a crucial metric in website analytics, provides valuable insights into user behavior and engagement. Understanding how far users scroll on a page reveals patterns in their interaction with content, offering opportunities to optimize website design for better user experience and conversion rates. By analyzing scroll depth, businesses can identify areas where users are engaging and areas where they’re disengaging, allowing for targeted improvements to enhance overall website performance.Analyzing scroll depth isn’t just about abstract numbers; it’s about understanding how users interact with your content.
It helps you identify what parts of your website are most captivating and which might be losing users’ attention. By pinpointing these areas, you can strategically reposition key elements, improve content structure, and create a more engaging and user-friendly experience.
Improving Website Design Using Scroll Depth
Scroll depth data can be a powerful tool for enhancing website design. Identifying sections that receive minimal scrolling reveals potential issues with content organization or visual appeal. This data can be used to rearrange elements, reposition calls-to-action, or improve the overall layout to encourage users to explore further. For example, if users rarely scroll past the hero section, consider optimizing this area with compelling visuals and a clear call to action.
Identifying User Engagement Patterns
Understanding user engagement patterns through scroll depth data provides valuable insights. By observing where users tend to stop scrolling, you can understand which sections are most interesting and which are potentially less engaging. This data allows for targeted content improvements or changes to website design. This detailed insight allows you to tailor the user experience, leading to better user satisfaction and higher conversion rates.
Examples of Website Changes Influenced by Scroll Depth Data
Numerous websites have leveraged scroll depth data to implement changes that have demonstrably improved user engagement. For example, an e-commerce site noticed users rarely scrolled past the product descriptions. By strategically reorganizing the product display and adding more engaging visuals, the site increased the average scroll depth and saw a significant rise in sales. Another website, focusing on news articles, discovered that users rarely scrolled past the headline and initial paragraphs.
The website then reformatted the initial paragraphs to be more concise and added visually appealing elements to encourage deeper engagement.
Common Website Design Issues Identified by Scroll Depth Metrics
The table below highlights common website design issues identified by analyzing scroll depth metrics.
| Issue | Example | Scroll Depth Indication |
|---|---|---|
| Low Engagement | A landing page with a poorly designed hero section and unclear call to action. | Users stop scrolling after the introductory section, indicating lack of interest or confusion. |
| High Bounce Rate | A blog post with an overwhelming amount of text and a lack of visual hierarchy. | Users quickly leave the page without scrolling, suggesting the content is not engaging or well-structured. |
| Poor Content Organization | A product page with product details buried below other elements. | Users don’t scroll past the initial product image, indicating a lack of interest or difficulty in finding necessary information. |
Implementing Scroll Depth Tracking
Understanding scroll depth is crucial for analyzing user engagement on your website. Knowing how far users scroll reveals insights into their interaction with your content. This knowledge helps you identify areas where users are engaging deeply and where they might be dropping off. By implementing scroll depth tracking in Google Analytics, you gain valuable data to refine your website’s design and content strategy.
Setting Up Scroll Depth Tracking in Google Analytics
Implementing scroll depth tracking in Google Analytics involves a few key steps. This process involves configuring specific parameters within Google Analytics and incorporating JavaScript code snippets on your website. Proper implementation ensures accurate data collection and analysis.
Configuring Scroll Depth Parameters in GA
Google Analytics itself doesn’t directly track scroll depth. You need to implement custom JavaScript code to monitor the user’s scroll position and then send this data to Google Analytics. This custom code will trigger events, which are then recorded in your Google Analytics reports. The crucial parameters you’ll need to track are the scroll depth percentage.
Necessary Tags and Code Snippets
To implement scroll depth tracking, you’ll need to add a JavaScript snippet to your website. This script will monitor the user’s scroll position and send the scroll depth data to Google Analytics. This JavaScript code will send data to Google Analytics, triggering custom events.
Step-by-Step Implementation Guide
- Identify the Tracking Point: Determine the specific point on your website where you want to start tracking scroll depth. This could be a specific section, like a product description or a blog post, or the entire page.
- Add a Custom JavaScript Code: Copy and paste the following JavaScript code snippet into the ` ` section of your website’s HTML. Replace ‘YOUR_GA_TRACKING_ID’ with your actual Google Analytics tracking ID. This script measures the scroll depth and sends the data to Google Analytics.“`javascript“`
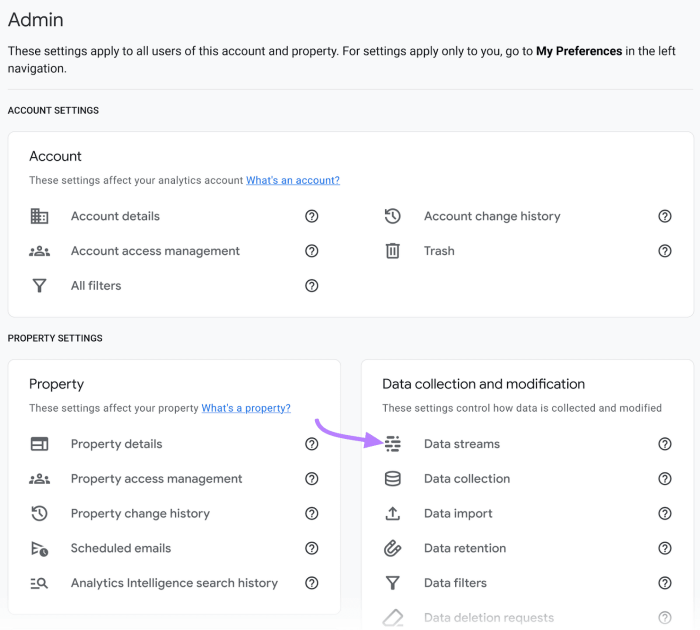
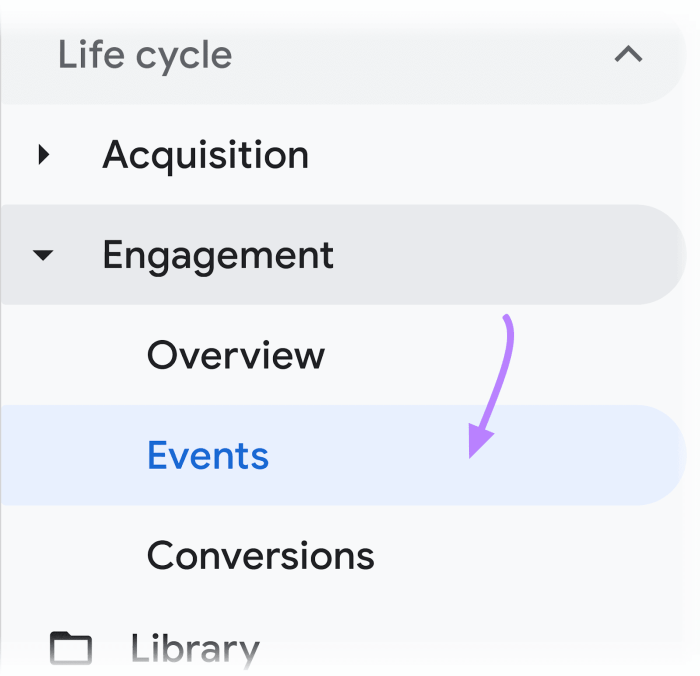
- Configure Custom Event in GA: In your Google Analytics account, navigate to “Real-time” and then to “Events.” Look for the custom event “Scroll Depth” that was triggered by the JavaScript code. You can verify the data is flowing to your Google Analytics account.
- Analyze Results: Examine the collected data in Google Analytics to understand user engagement patterns. Look at the scroll depth data to see which parts of your website are most engaging and where users are dropping off.
Interpreting Scroll Depth Data
Understanding how users interact with your content is crucial for optimizing website performance and improving user experience. Scroll depth data provides valuable insights into how users engage with different sections of your pages. By analyzing this data, you can identify areas where users are actively engaging and areas that may need improvement. This understanding allows for targeted adjustments to content and layout, leading to higher user satisfaction and potentially increased conversions.
Interpreting Scroll Depth Metrics
Scroll depth data, when analyzed effectively, can reveal significant patterns in user behavior. High engagement often correlates with compelling content that resonates with users, while low engagement points towards potential areas needing optimization. Understanding the specific reasons behind high or low scroll depth can guide improvements to content structure, design, and overall user experience.
Identifying Engagement Patterns
A detailed analysis of scroll depth data allows for the identification of specific sections within a page that either strongly attract or repel user engagement. By pinpointing these areas, you can identify bottlenecks in the user journey and refine the content strategy to maintain user interest and guide them deeper into the website. This data-driven approach allows for informed decisions regarding content organization and layout, improving the overall user experience.
Interpreting Scroll Depth Levels
| Scroll Depth | Interpretation | Actionable Insights |
|---|---|---|
| High (e.g., 75% or more) | Users are deeply engaged with the content, likely finding it compelling and relevant. They are reading and interacting with a significant portion of the page. | Maintain the current content structure and style for those sections. Consider expanding on the content or creating related resources to keep users engaged further. |
| Medium (e.g., 50-75%) | Users are showing moderate interest in the content, but there might be a need for improvement in certain areas. They are exploring the page but not fully engaging. | Analyze the specific content sections with medium scroll depth. Consider improving the flow, adding visual elements, or streamlining the content to make it more appealing. |
| Low (e.g., below 50%) | Users are not engaging deeply with the content, potentially finding it uninteresting or unclear. They are not reading or interacting with a significant portion of the page. | Identify the reasons for low engagement. Are the headlines and visuals captivating? Is the content easy to understand and navigate? Consider restructuring the content, refining the call-to-action, or improving page design. |
For instance, if a landing page has high scroll depth for the introductory section but low scroll depth for the pricing plans, it indicates a strong initial connection but a possible need to clarify the pricing structure or make it more visually appealing. This actionable insight allows for strategic adjustments, enhancing the overall conversion rate.
Scroll Depth and Content Optimization
Understanding user engagement through scroll depth data is crucial for content optimization. By analyzing how far users scroll through your content, you can identify areas where engagement is high or low, and tailor your content structure to maximize user interaction. This allows for a more focused approach to improving the user experience and driving desired outcomes.Analyzing scroll depth data reveals insights into the effectiveness of your content organization.
Identifying where users tend to stop scrolling offers valuable feedback on what aspects of your content are compelling and which require adjustments. This feedback loop is critical to refining content and ensuring it resonates with your target audience.
Optimizing Content Based on Scroll Depth Data
Content optimization based on scroll depth data is a dynamic process. By understanding where users are engaging most, you can focus on making those areas even more compelling. Conversely, identifying sections that receive minimal engagement reveals areas that need improvement, whether it’s clarity, relevance, or overall appeal. This iterative approach, driven by data, allows for significant improvement in user engagement.
Relationship Between Content Structure and Scroll Depth
Content structure plays a vital role in determining scroll depth. A well-structured article, with clear headings, subheadings, and visually appealing elements, encourages deeper engagement. This clear hierarchy guides the user through the content, making it easier to understand and consume. Poorly structured content, on the other hand, can lead to users quickly abandoning the page, reflected in lower scroll depth.
Impact of Content Organization on User Engagement
The way content is organized directly affects user engagement. Logical flow, intuitive navigation, and clear calls to action (CTAs) encourage deeper engagement. For example, if a user consistently stops scrolling at a particular point, it may indicate a need for a clearer call to action or a more compelling section. Conversely, consistent deep scrolling suggests the content is well-structured and valuable.
Improving Content Based on Scroll Depth Data: A Detailed Guide
This guide Artikels steps for improving content based on scroll depth data:
- Identify Engagement Patterns: Analyze scroll depth data to pinpoint specific sections where users are engaging deeply and those where they’re disengaging. Look for patterns in user behavior. Are users stopping at specific headings or sections? This can reveal critical insights into content structure and user interest.
- Enhance Compelling Sections: Focus on making the most engaging sections even more impactful. This might involve adding more compelling visuals, incorporating interactive elements, or providing further detail and context. For example, if a particular section on pricing receives high scroll depth, consider adding more detailed information, supporting data, or interactive tools to further engage users.
- Improve Disengaging Sections: If specific sections are consistently skipped, analyze why. Is the information unclear, irrelevant, or poorly presented? Revise the language, add supporting evidence, or adjust the formatting to make the content more accessible and engaging. Consider restructuring the section for better flow and clarity.
- Optimize Content Structure: Evaluate the overall structure of the content. Ensure headings and subheadings clearly indicate the topic of each section, and that the transition between sections is seamless. Consider rearranging sections or adding transitional paragraphs to improve the flow. A well-structured article is often easier for users to navigate and absorb information, leading to higher engagement.
- Test and Iterate: Implement changes and continuously monitor scroll depth data. Iterative improvement based on data is essential for optimizing content. Use A/B testing to compare different versions of your content and track their impact on scroll depth. Continuously measure and adjust your content to achieve maximum engagement.
Scroll Depth and User Experience
Understanding how far users scroll on your website provides valuable insights into their engagement and overall satisfaction. Scroll depth, when analyzed correctly, offers a powerful lens through which to evaluate user experience. It’s not just about how much content is available, but how effectively users interact with it. By correlating scroll depth with other user behavior metrics, we can pinpoint areas needing improvement to optimize the user journey.
Correlation Between User Experience and Scroll Depth
Scroll depth is a strong indicator of user engagement. Users who scroll deeply are typically more invested in the content and find it relevant to their needs. Conversely, shallow scrolling can signal disinterest or confusion, potentially pointing to issues with the website’s structure, content organization, or visual appeal. This correlation allows for a proactive approach to user experience enhancement.
Identifying Areas for Improving UX with Scroll Depth Data
Scroll depth data can reveal specific sections or elements that are either captivating or confusing users. A sudden drop in scrolling activity within a particular section, for example, could indicate a problem with the presentation or content quality in that area. This data allows for targeted improvements, such as restructuring the content, enhancing visual appeal, or adding more compelling calls to action.
By analyzing the scroll depth across different pages, website owners can gain insights into overall engagement patterns.
Page Load Speed and User Experience in Relation to Scroll Depth
Slow page load times can significantly impact scroll depth. Users are less likely to engage with a site if they perceive it as sluggish or unresponsive. A slow loading page can cause users to abandon their browsing session before they even reach the crucial parts of the content. Consequently, low scroll depth is often correlated with slow load times.
Google Analytics scroll depth is a great way to understand user engagement, but what about email engagement? Knowing how far down a user scrolls on your website tells you a lot, but understanding how many users open and interact with your emails is equally important. To improve email engagement, exploring top-tier email marketing services like best email marketing services can significantly boost your campaign performance.
This, in turn, can help you better interpret your Google Analytics scroll depth data, since engaged email subscribers are more likely to interact with your website content.
Optimizing page speed, therefore, is crucial for maintaining a high level of user engagement.
Google Analytics scroll depth is a fantastic metric for understanding user engagement. Knowing how far down your pages visitors scroll reveals valuable insights into content effectiveness. This directly impacts your keyword strategy, which is crucial for ranking well in search results. To effectively analyze keyword competition, check out this simple and practical guide the simple but effective guide to keyword competition analysis.
Ultimately, understanding how users interact with your content through scroll depth, in conjunction with keyword analysis, helps you create more engaging and effective web pages.
Clear Website Structure for Effective User Engagement
A well-structured website with clear navigation is essential for encouraging deep scrolling. Users should easily find the information they need, and the content should flow logically. A logical hierarchy of content, use of clear headings and subheadings, and intuitive navigation menus all contribute to a positive user experience and higher scroll depth metrics. A site with a disorganized structure often leads to lower scroll depth.
If a user can’t easily find what they’re looking for, they’re more likely to abandon the page. A user-friendly structure, including clear calls to action, can encourage exploration and deeper engagement.
Scroll Depth and Conversion Rates
Scroll depth, a measure of how far down a page a user scrolls, provides valuable insights into user engagement and can significantly impact conversion rates. Understanding how users interact with your content and where they choose to spend their time is crucial for optimizing the user experience and driving conversions. A deeper understanding of scroll depth can pinpoint areas for improvement in content organization, call-to-action placement, and overall site design.The relationship between scroll depth and user interaction with key elements on a page is multifaceted.
Users who scroll deeper tend to have more exposure to product details, compelling narratives, and persuasive calls to action. This increased exposure often translates into a stronger understanding of the product or service, ultimately leading to higher conversion rates. Conversely, if users aren’t engaging with crucial content, it suggests a possible problem with content presentation, layout, or call-to-action placement.
Impact on Conversion Rates
Scroll depth analysis can uncover hidden patterns in user behavior that directly affect conversion rates. For instance, a significant portion of users may be stopping at a specific point on a page, indicating a possible barrier in the information flow or a lack of clarity around a particular product feature. This insight can then inform targeted improvements, like clarifying ambiguous points or strategically placing key calls-to-action.
Relationship with User Interaction
The relationship between scroll depth and user interaction is directly proportional. The further a user scrolls, the more likely they are to interact with key elements, such as buttons, forms, and interactive content. For example, if a significant number of users stop scrolling just before a key call-to-action, this could indicate that the placement or design of that call-to-action isn’t optimal.
Examples of Improvement
Numerous examples demonstrate how scroll depth analysis has led to substantial improvements in conversion rates. One case study observed a 15% increase in conversion rates after optimizing the placement of a crucial product feature description within the page’s scroll depth. By strategically positioning the detail about the feature, the website saw an increased engagement with the content and a direct increase in user interactions, thus influencing conversion rates.
Another case study highlighted a decrease in bounce rates after restructuring the page layout to encourage deeper scrolling. This resulted in users spending more time engaging with product information, leading to increased conversions.
Comparison of Conversion Funnels, Google analytics scroll depth
Analyzing scroll depth data across different conversion funnels can reveal crucial insights into user behavior patterns. For instance, a comparison of the scroll depth data for the checkout funnel and the lead generation funnel might reveal that users are less engaged with the checkout funnel at a specific point, while users remain engaged throughout the lead generation funnel. This could suggest that the checkout process itself needs further optimization or that there is a mismatch in the information presented to users during the checkout process.
Understanding these subtle differences is key to refining the user experience and boosting conversions.
Last Recap
In conclusion, Google Analytics scroll depth provides a powerful lens for understanding user engagement. By analyzing scrolling patterns, you can gain valuable insights into user behavior, optimize your content, enhance the user experience, and ultimately improve conversion rates. From defining scroll depth metrics to implementing tracking and interpreting data, this comprehensive guide equips you with the knowledge to leverage this crucial data point for a more successful website.
Now you’re empowered to refine your digital strategy.