Diagnosing traffic drops using Google Analytics sets the stage for understanding why your website traffic might be dwindling. This in-depth look explores common reasons behind traffic decreases, from external factors to internal website issues, and how to pinpoint the problem using Google Analytics. We’ll dive into specific Google Analytics features, metrics, and data analysis techniques to effectively identify the root cause of any traffic drop.
The guide will walk you through a structured procedure for investigating traffic drops, from analyzing traffic sources and user behavior to identifying external factors and internal website problems. We’ll cover strategies for recovering lost traffic and presenting your findings with compelling data visualizations. This comprehensive approach will help you gain a deeper understanding of your website’s performance and take corrective actions.
Identifying Potential Causes of Traffic Drops
Understanding why website traffic declines is crucial for effective website management. A sudden or gradual drop in visitors can indicate a variety of issues, ranging from external market trends to internal website problems. Identifying the root cause is the first step toward implementing effective solutions and restoring traffic flow.
Common Reasons for Traffic Drops
Understanding the potential reasons behind traffic drops is essential for targeted solutions. External factors, such as changes in search engine algorithms or competitor actions, can significantly influence website visibility. Conversely, internal website issues, like poor site design or technical glitches, can also hinder traffic growth.
- External Factors: Market trends, competitor actions, changes in search engine algorithms, and seasonal variations are all external factors that can impact website traffic. A significant algorithm update from Google, for instance, can lead to a sudden drop in rankings for certain s, causing a direct decline in organic traffic. Similarly, a competitor launching a highly effective marketing campaign can draw away users and negatively affect your website’s traffic.
- Internal Website Issues: Technical problems like server errors, slow loading times, broken links, or outdated content can negatively affect user experience. Poor website design, navigation, or user interface can also discourage visitors, causing them to leave the site quickly without interacting further. A sudden increase in bounce rate, meaning visitors leave the site after landing on a single page, often indicates an issue with the user experience on the landing page or the overall website design.
Distinguishing Short-Term and Long-Term Drops
Recognizing the duration of the traffic drop is crucial for determining the likely cause. A short-term dip might be due to a temporary event, while a sustained decrease over a longer period suggests a more significant underlying issue.
- Short-term drops are typically caused by isolated events such as temporary technical issues, promotional campaigns by competitors, or temporary changes in search engine algorithm rankings. Tracking these fluctuations is essential to identify whether the drop is a temporary phenomenon or the start of a longer-term trend. For example, a temporary outage of your website’s hosting server might cause a sharp drop in traffic that quickly recovers once the issue is resolved.
- Long-term drops often signal deeper issues, such as outdated content, a poor user experience, or a lack of optimization for search engines. A consistent decline in traffic over weeks or months may necessitate a comprehensive review of the website’s performance and user experience. This could require content updates, audits, or a complete redesign of the website to address the fundamental issue causing the drop in traffic.
Comparison of Traffic Drop Types
The following table provides a comparison of different types of traffic drops and their likely causes.
Figuring out why your website traffic is down can be tricky, and Google Analytics is a lifesaver. By meticulously analyzing bounce rates, session durations, and source traffic, you can pinpoint the problem. Understanding whether you’re focusing on maximizing value for users or just extracting revenue is key to optimizing your strategy. This often comes down to a fundamental shift in thinking about value creation vs revenue extraction.
Ultimately, a better user experience often translates into more traffic and engagement, proving that a focus on value creation can significantly impact website performance. By adjusting your strategies accordingly, you can start seeing positive results in your traffic numbers.
| Type of Traffic Drop | Likely Causes | Manifestation in Google Analytics Data |
|---|---|---|
| Sudden Drop | Temporary technical issues, competitor promotions, algorithm updates, sudden change in search engine rankings | A sharp decline in traffic within a short timeframe, potentially followed by a quick recovery. A notable increase in bounce rate or a sudden reduction in average session duration. |
| Gradual Drop | Outdated content, poor user experience, inadequate optimization, lack of new content, changes in user preferences, decreased visibility in search results | A steady, gradual decrease in traffic over a longer period. This may be accompanied by an increase in bounce rate and a decrease in time spent on site. |
Using Google Analytics Features for Diagnosis: Diagnosing Traffic Drops Using Google Analytics
Unveiling the mysteries behind traffic drops requires a systematic approach. Google Analytics provides a wealth of data to pinpoint the root cause of these declines. This exploration delves into the specific features and reports within Google Analytics to aid in the diagnosis process. A structured approach, coupled with an understanding of key metrics, empowers you to understand and address traffic fluctuations effectively.Understanding the intricacies of Google Analytics reports allows for a deeper dive into the potential causes of a traffic drop.
By analyzing various metrics, you can discern if the drop is a temporary blip or a more significant, sustained issue. The methods Artikeld here equip you with the tools to navigate the wealth of data within Google Analytics, translating it into actionable insights.
Structured Procedure for Investigating Traffic Drops
A structured procedure helps organize the investigation of traffic drops. Begin by defining the specific time period experiencing the drop. Next, compare this period to a similar prior period, focusing on key metrics. Use Google Analytics’ date range comparison tool to identify patterns. Analyze the data from different perspectives, considering various user segments, sources, and pages.
Thorough analysis of these elements will enhance your understanding of the issue and guide your actions. Finally, document the entire process for future reference and potential reoccurrence analysis.
Key Metrics to Monitor in Google Analytics
Several key metrics are crucial for identifying traffic issues. Understanding their significance allows for proactive identification of problems.
- Sessions: The total number of user sessions during a given period. A decline in sessions directly indicates a decrease in overall traffic. Interpreting the context of this decline is essential to determine the source of the drop. For example, a consistent decrease in sessions over several months might point to broader market trends or changing user behavior.
- Bounce Rate: The percentage of sessions with only one page view. A sudden spike in bounce rate often suggests a problem with a website’s content, user experience, or landing pages. For instance, a new design change could cause users to leave after seeing only one page. This metric should be analyzed in relation to other data points, such as time on site, to have a complete picture.
- Average Session Duration: The average time users spend on your website during a session. A significant drop in average session duration could suggest issues with website engagement, content quality, or navigation. A consistent decline over a period might indicate an underlying problem with content or site functionality.
- Conversion Rate: The percentage of sessions that result in a desired action (e.g., making a purchase). A decrease in conversion rate could indicate a problem with the sales funnel, the user experience on the checkout page, or the value proposition of the product or service. For instance, a complex checkout process can lead to a drop in conversion rates.
Interpreting Data Patterns in Google Analytics Dashboards
Analyzing data patterns is crucial for diagnosis. Various patterns indicate different issues.
- Sudden Dips: A sudden and significant drop in traffic could indicate a temporary issue, such as a website outage, technical problems, or a major event that impacts user behavior. For example, a scheduled maintenance period could cause a sharp dip.
- Consistent Decline: A consistent and gradual decrease in traffic over a longer period usually points to a more persistent issue. This could be due to a change in search engine rankings, algorithm updates, or a problem with website performance. For instance, a slow loading website could lead to users leaving and a gradual decline in traffic.
- Seasonal Trends: Traffic often fluctuates based on seasonality. Understanding seasonal patterns helps distinguish genuine traffic drops from expected seasonal variations. For example, e-commerce sites often experience a surge in traffic during the holiday season.
Utilizing Date Range Comparisons in Google Analytics
Date range comparisons are vital for identifying trends. By comparing current data to previous periods, you can spot significant changes in traffic patterns. This helps in identifying the exact time frame where the drop occurred and understanding if the issue is new or has been present for some time. This method aids in determining if the issue is temporary or long-term.
For example, if a drop in traffic occurs after a website update, this suggests that the update may be the cause.
Analyzing Traffic Sources and User Behavior
Uncovering the reasons behind a traffic dip requires a deep dive into both where your visitors are coming from and how they’re interacting with your site. This section will explore methods for pinpointing the source of the problem by analyzing traffic sources and user behavior patterns within Google Analytics.Understanding how different traffic channels are performing, and how user behavior has changed, is crucial in identifying the root cause of a traffic drop.
By meticulously examining these factors, you can determine whether the issue lies with a specific advertising campaign, a change in search engine algorithm, or shifts in user behavior.
Identifying Traffic Source Performance
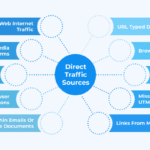
Understanding which traffic sources are experiencing the most significant drops is a critical first step. Google Analytics provides detailed breakdowns of traffic by source (e.g., organic search, social media, referrals). By comparing traffic volume before and after the drop, you can isolate specific channels that have seen a significant decrease. Look for trends in the data; a consistent decline from a specific source is a strong indicator.
For example, a sudden and drastic drop in traffic from a particular social media platform might suggest a change in the platform’s algorithm or a campaign issue.
Figuring out why website traffic dips using Google Analytics is crucial. But beyond the data, understanding your audience’s perspective is key. For example, if you’re trying to increase engagement, exploring how developing a distinct point of view can explode your fan base is equally important. how developing point of view can explode fan base will help you craft content that resonates deeply.
Ultimately, combining insights from Google Analytics with a strong point of view will help you understand your audience better and improve your website’s performance.
Comparing User Behavior Patterns
Comparing user behavior before and after the traffic drop is essential to understand the user experience. This involves examining metrics like bounce rate, average session duration, pages per session, and conversion rates. Significant shifts in these metrics can highlight issues with content quality, site navigation, or user experience. For example, a sudden increase in bounce rate could indicate that visitors are finding the site less engaging or relevant.
User Behavior Metrics for Diagnosis
Various user behavior metrics can provide valuable insights into the root cause of a traffic drop. Examining these metrics allows you to understand how users interact with your website and identify areas needing improvement. A drop in engagement metrics suggests a potential issue with your site or content.
- Bounce Rate: The percentage of visitors who leave your site after viewing only one page. A significant increase in bounce rate often indicates issues with content relevance, site navigation, or user experience.
- Average Session Duration: The average time visitors spend on your website during a session. A noticeable decrease can signal issues with website content, layout, or overall engagement.
- Pages per Session: The average number of pages visited by users during a session. A decline in pages per session might suggest a lack of user interest or difficulty in navigating the site.
- Conversion Rate: The percentage of visitors who complete a desired action, such as making a purchase or signing up for a newsletter. A decrease in conversion rates could indicate problems with the checkout process, pricing, or calls to action.
Common User Behavior Indicators and Likely Causes
The table below presents a snapshot of common user behavior indicators and their potential causes. This analysis is based on common web analytics patterns.
| User Behavior Indicator | Likely Cause |
|---|---|
| Increased Bounce Rate | Poorly targeted content, confusing navigation, slow page load times, irrelevant content |
| Decreased Average Session Duration | Lack of engaging content, slow page load times, poor site structure, irrelevant content |
| Decreased Pages per Session | Lack of compelling content, poor site structure, difficulty finding information, poor internal linking |
| Decreased Conversion Rate | Complex checkout process, high prices, unclear calls to action, issues with payment gateway, irrelevant landing pages |
External Factors Affecting Traffic

Understanding website traffic fluctuations requires looking beyond just internal improvements. External factors, often beyond our direct control, can significantly impact visitor numbers. These factors can be subtle shifts, like seasonal changes, or more dramatic events, such as competitor actions or algorithm updates. Knowing how to identify and measure these influences is crucial for effective website management.
Identifying External Factors
External factors influencing website traffic are diverse and can impact traffic positively or negatively. These factors can include seasonal trends, competitor activities, changes in search engine algorithms, and even major global events. Understanding these factors is vital for adjusting strategies and mitigating potential negative impacts.
Using Google Analytics for External Factor Tracking
Google Analytics offers powerful tools to monitor and track external influences on website traffic. Data on seasonal patterns, competitor activity, and search engine algorithm updates can be tracked.
Monitoring Traffic Patterns
Monitoring for sudden or gradual shifts in traffic patterns is a crucial step in detecting external influences. This involves setting up alerts within Google Analytics to flag significant changes in key metrics. For example, a significant drop in organic traffic might indicate a recent search engine algorithm update. Regularly reviewing traffic trends allows for timely identification and response.
Analyzing External Factor Impacts
Analyzing and differentiating the impact of external factors on traffic drops is a nuanced process. Using Google Analytics’ comparison tools, website managers can compare current traffic patterns to historical data. For example, comparing traffic in the current quarter to the same quarter last year can highlight seasonal trends. By analyzing various metrics and comparing them to known external events, website managers can gain insights into the impact of these factors.
Example: Seasonal Trends
Consider a company selling winter coats. In the summer months, their traffic would be significantly lower than during the winter. Google Analytics can track this seasonal fluctuation, allowing the company to understand that the dip in traffic is a natural occurrence and not a sign of a problem with their website or marketing efforts.
Example: Competitor Activities
If a competitor launches a significant marketing campaign targeting the same s, a website might experience a short-term drop in organic search traffic. By analyzing traffic data alongside the competitor’s campaign launch date, the website manager can correlate the decrease in organic traffic to the competitive activity.
Example: Search Engine Algorithm Updates
A significant drop in organic search traffic could indicate an update to search engine algorithms. Tracking traffic patterns alongside known algorithm updates can help determine if the drop is a direct result of the update. Analyzing rankings and traffic sources can further reveal the extent of the algorithm’s impact.
Internal Website Issues and Troubleshooting

Troubleshooting internal website problems is crucial for maintaining consistent traffic. A seemingly minor glitch can significantly impact user experience and, consequently, your website’s overall performance in Google Analytics. Identifying these issues early and addressing them promptly can prevent substantial traffic drops and maintain a positive user journey.
Figuring out why your website traffic is tanking can be tricky, but Google Analytics is your secret weapon. It’s amazing for pinpointing traffic drops. However, sometimes a website’s pricing page isn’t optimized to convert visitors into customers, which can also dramatically impact overall traffic. A well-designed pricing page that converts is essential for boosting your bottom line, and understanding those conversion rates will in turn help you diagnose traffic drops more effectively.
So, dive deep into your Google Analytics reports, and you’ll be on your way to a healthier website.
Common Internal Website Problems Leading to Traffic Drops
Internal website issues often stem from technical glitches, content discrepancies, or poorly executed updates. These issues can manifest as website downtime, server errors, slow loading speeds, broken links, 404 errors, or outdated content. Each of these problems can deter visitors, leading to a measurable drop in traffic reflected in Google Analytics. Addressing these problems is critical to maintain a steady flow of users.
Diagnosing Technical Issues with Google Analytics
Google Analytics provides valuable data for diagnosing technical issues. Analyzing key metrics like bounce rate, average session duration, and pages per session can reveal patterns indicative of problems. A sudden spike in bounce rate, for example, might signal slow loading times, while a drastic drop in average session duration could suggest website downtime or other technical glitches. Monitoring these metrics alongside user behavior data helps pinpoint the exact nature of the issue.
Evaluating the Impact of Content Changes and Updates
Content changes or website updates can sometimes negatively impact traffic. For example, a poorly implemented redesign or significant content overhaul might lead to temporary traffic fluctuations. Monitoring traffic patterns before, during, and after such changes using Google Analytics is essential. Compare traffic data from the period before the update to the period afterward to assess the impact on key metrics like new users, returning users, and traffic sources.
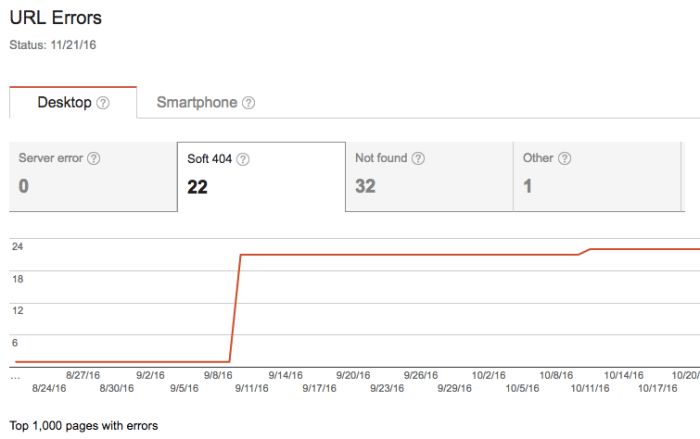
Isolating Issues like Broken Links, 404 Errors, and Outdated Content
A crucial aspect of website troubleshooting is isolating the source of the problem. Broken links, 404 errors, and outdated content can all lead to frustrated users and reduced traffic. Using Google Analytics, identify pages experiencing high bounce rates or low time on site. Further investigation should focus on these pages, checking for broken links and 404 errors using a website auditing tool.
Outdated content, such as product descriptions or blog posts, should also be reviewed.
Strategies for Recovering Lost Traffic
Recovering lost website traffic requires a multifaceted approach, going beyond simple fixes. It’s crucial to understand the underlying causes of the drop to develop effective recovery strategies. This involves analyzing data, identifying pain points, and implementing targeted solutions. A proactive approach, including ongoing monitoring and adaptation, is vital for sustained traffic growth.Once you’ve pinpointed the reasons behind the traffic decline, you can formulate a strategy to address the issues.
This involves considering both internal website factors and external influences, developing actionable plans, and measuring the impact of implemented changes.
Developing a Recovery Plan
A comprehensive recovery plan Artikels specific steps to reverse the traffic decline. This plan should encompass short-term and long-term strategies, aiming to not only restore lost traffic but also improve overall website performance. It’s important to prioritize actions based on the severity of the identified issues.
Addressing Internal Website Issues
Internal website issues, such as poor site speed, broken links, or a confusing user experience, directly affect user engagement and, consequently, traffic. Addressing these issues is crucial for recovery.
- Optimizing Site Speed: A slow-loading website negatively impacts user experience and search engine rankings. Implementing caching mechanisms, optimizing images, and using a Content Delivery Network (CDN) can significantly improve site speed. For example, a study by Google showed that a one-second delay in page load time can result in a 7% reduction in conversions.
- Fixing Broken Links: Broken links create a frustrating user experience and signal poor website maintenance to search engines. Regularly checking and fixing broken links is essential. Automated tools can help in identifying and fixing these issues.
- Improving User Experience (UX): A user-friendly website with clear navigation, intuitive design, and relevant content is more likely to retain visitors. Testing different design elements and user flows can identify areas needing improvement. For instance, A/B testing different calls-to-action on a landing page can help determine which performs best.
Addressing External Factors
External factors, such as changes in search engine algorithms, competitor activity, or industry trends, can also contribute to traffic drops. Understanding these factors is crucial for developing effective recovery strategies.
- Adapting to Search Engine Algorithm Changes: Search engine algorithms are constantly evolving. Staying updated on algorithm changes and adjusting website content and structure accordingly is vital. For example, Google’s frequent updates regarding mobile-first indexing directly impact how websites rank in search results.
- Monitoring Competitor Activity: Keeping an eye on competitors’ strategies and content can help you identify opportunities and adapt your own approach. Analyzing their s, content, and promotional activities can provide valuable insights.
- Responding to Industry Trends: Changes in industry trends and user behavior can significantly impact traffic. Monitoring industry news and adapting your website content and offerings accordingly is important. For example, if a new technology trend emerges, updating your website to reflect that trend could draw in users interested in the topic.
Tracking the Impact of Implemented Solutions
Tracking the impact of implemented solutions is essential for assessing the effectiveness of the recovery plan. This requires setting up clear metrics and regularly monitoring their performance.
- Defining Key Performance Indicators (KPIs): Select KPIs that directly correlate with website traffic, such as bounce rate, average session duration, conversion rate, and new user acquisition. For instance, a higher bounce rate might indicate that visitors aren’t finding the information they need on your site.
- Implementing Tracking Mechanisms: Utilize Google Analytics or other analytics tools to track changes in these KPIs. This will help in assessing the effectiveness of each implemented solution.
- Regularly Monitoring and Evaluating Results: Regularly review the data to see how implemented solutions are affecting the metrics. Adapt the strategy as needed to optimize the results.
Data Visualization and Reporting
Uncovering the reasons behind traffic drops requires insightful analysis and clear communication. Effective data visualization is crucial for quickly identifying patterns, trends, and the root causes of these declines. This section will guide you in presenting your Google Analytics findings in a way that is both compelling and actionable.
Visualizing Traffic Drop Data in Google Analytics
Understanding the nuances of a traffic drop often necessitates the use of multiple visualizations. A single chart might not capture the entire picture. A comprehensive approach allows you to investigate the situation from various angles.
| Visualization Type | Description | Example Application |
|---|---|---|
| Line Charts | Excellent for showing trends over time. Identify seasonal fluctuations or sudden drops. | Tracking website traffic monthly to spot declines or increases. |
| Bar Charts | Useful for comparing traffic sources, user demographics, or specific date ranges. | Comparing organic traffic vs. paid traffic to pinpoint which is experiencing a drop. |
| Area Charts | Similar to line charts, but emphasizes the accumulated total over time. | Illustrating the total number of sessions lost over a given period. |
| Pie Charts | Ideal for displaying the distribution of traffic sources (e.g., organic, referral, social). Identify which sources are contributing less. | Visualizing the breakdown of traffic sources to see if a specific source is responsible for the drop. |
| Map Overlay | Helpful for analyzing geographic traffic patterns and determining if a specific region has seen a decrease. | Identifying if traffic from a particular region or country has dropped significantly. |
| Scatter Plots | Effective for identifying correlations between variables, such as user behavior and traffic volume. | Examining the relationship between bounce rate and session duration to see if a change in user behavior might be a contributing factor. |
Presenting Findings and Recommendations, Diagnosing traffic drops using google analytics
Clearly presenting your findings is as important as the analysis itself. Use a concise and structured format, combining visuals with brief, impactful text. Avoid jargon and focus on communicating the key takeaways.
- Concise Summary: Start with a brief summary of the key findings, outlining the nature of the traffic drop and its potential causes.
- Data-Driven Explanation: Support the summary with concrete data from your visualizations. Quantify the drop in traffic and highlight any significant trends or correlations.
- Actionable Recommendations: Offer specific, actionable recommendations based on your analysis. Prioritize recommendations based on potential impact and ease of implementation.
Compelling Visual Examples
A well-designed visualization can dramatically improve the clarity of your findings. Consider these examples:
- A line chart showing a sharp decline in organic traffic over a specific period, paired with a bar chart comparing organic traffic to paid traffic. This might indicate a change in search engine algorithm impacted organic traffic.
- A pie chart illustrating the breakdown of traffic sources, showing a significant drop in traffic from a particular social media platform. This could highlight a change in social media platform algorithm or a brand issue on the platform.
- A map overlaying traffic data, clearly showcasing a drop in traffic from a particular region, perhaps due to a local marketing campaign or technical issues affecting a specific region.
Recommended Visualization Types
The choice of visualization should be guided by the type of data and the message you want to convey.
- Line Charts: For tracking trends over time.
- Bar Charts: For comparing different categories or time periods.
- Pie Charts: For visualizing proportions or breakdowns.
- Area Charts: For emphasizing accumulated totals.
- Map Overlays: For geographic traffic analysis.
Last Recap
In conclusion, diagnosing traffic drops using Google Analytics is a crucial aspect of website optimization. By systematically examining traffic sources, user behavior, and external factors, you can pinpoint the cause of any drop and implement effective recovery strategies. This comprehensive guide provides a framework for understanding and addressing these issues, enabling you to improve your website’s performance and achieve your online goals.
Remember that consistent monitoring and analysis are key to maintaining a healthy and thriving website.