7 important metrics track contents success – 7 important metrics track content success is a comprehensive guide to understanding and measuring the effectiveness of your online content. We’ll explore how to define, track, and analyze key metrics across various platforms and industries, ultimately showing you how to align your content strategy with your business goals.
This in-depth analysis covers everything from identifying the right metrics to understanding user engagement and adapting your content strategy based on performance. Whether you’re an e-commerce business, a tech startup, or a financial institution, these principles can be applied to optimize your content for maximum impact.
Defining Content Success Metrics
Understanding how well your content performs is crucial for optimizing your strategy. Content success isn’t just about how many articles you publish; it’s about how effectively that content engages your audience and drives desired outcomes. This involves tracking a range of metrics that demonstrate its value.Content success metrics are quantifiable measures that reveal how well your content resonates with your target audience.
They help you understand what aspects of your content are working and where you need to adjust your approach. These metrics, when properly analyzed, provide a roadmap for improvement and better content creation.
Content Engagement Metrics
Effective content engages readers and keeps them interested. These metrics reveal how well your content captures and holds attention.
- Unique Page Views: This metric counts the number of individual visitors who view a specific page. It’s a fundamental measure of content visibility and reach. It’s measured by counting each unique visitor’s interaction with a specific page. Data collection often involves web analytics platforms like Google Analytics, which track visitor activity on your website. High unique page views indicate that your content is attracting a significant number of people.
- Time on Page: This metric measures the average amount of time visitors spend on a particular piece of content. A longer time on page suggests that the content is engaging and valuable to the reader. It’s calculated by dividing the total time spent by all visitors on the page by the number of visitors. Tools like Google Analytics provide this data.
Higher time on page indicates better engagement and potentially higher user satisfaction.
- Bounce Rate: This metric reflects the percentage of visitors who leave your website after viewing only one page. A low bounce rate indicates that your content is effective in keeping visitors engaged. It’s calculated as the percentage of single-page visits relative to total visits. Tools like Google Analytics provide this data. A low bounce rate suggests that your content is valuable and compelling enough to encourage further exploration.
Content Performance Metrics
These metrics reveal how effectively your content achieves its goals, whether it’s generating leads, driving sales, or building brand awareness.
- Conversion Rate: This metric measures the percentage of visitors who take a desired action, such as filling out a form, making a purchase, or signing up for a newsletter. It’s calculated as the number of conversions divided by the total number of visitors. Tools like marketing automation platforms and CRM systems can track these conversions. High conversion rates indicate that your content is effectively driving desired outcomes.
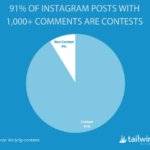
- Social Shares: This metric measures the number of times your content is shared on social media platforms. It reflects the virality of your content and its potential to reach a wider audience. Social media platforms provide data on shares and engagement. High social shares demonstrate the popularity and value of your content.
- Click-Through Rate (CTR): This metric measures the percentage of people who click on a link in your content. It’s a key indicator of how compelling your content is and how effectively it’s driving traffic to other relevant pages. CTR is calculated by dividing the number of clicks by the number of impressions (the number of times the link was displayed).
Tools like Google Analytics and advertising platforms track this data. High CTR suggests that your content is enticing enough to encourage clicks.
Content Metric Comparison Table
This table provides a comparative overview of the seven metrics discussed, highlighting their purpose and how they are measured.
| Metric | Purpose | Measurement | Data Collection Method |
|---|---|---|---|
| Unique Page Views | Measure of content visibility | Number of unique visitors | Web analytics platforms (e.g., Google Analytics) |
| Time on Page | Measure of engagement | Average time spent on a page | Web analytics platforms (e.g., Google Analytics) |
| Bounce Rate | Measure of engagement and relevance | Percentage of single-page visits | Web analytics platforms (e.g., Google Analytics) |
| Conversion Rate | Measure of achieving desired outcomes | Percentage of conversions | Marketing automation platforms, CRM systems |
| Social Shares | Measure of content virality | Number of shares on social media | Social media platforms (e.g., Facebook, Twitter) |
| Click-Through Rate (CTR) | Measure of content effectiveness in driving traffic | Percentage of clicks on links | Web analytics platforms (e.g., Google Analytics), advertising platforms |
Content Performance Across Platforms
Content success isn’t solely defined by its creation; its performance across various online platforms is equally crucial. Understanding how your content performs on different channels allows for strategic adjustments to maximize impact and reach your target audience effectively. Analyzing this performance necessitates a tailored approach, adapting your metrics to the specific characteristics of each platform.Different online platforms present unique opportunities and challenges for content distribution.
Tracking content success hinges on key metrics like viewership, engagement, and user ratings. Netflix, a master of content strategy, uses sophisticated analytics to fine-tune their offerings, as detailed in this insightful piece on how netflix uses analytics. Ultimately, these 7 crucial metrics are essential for understanding what resonates with audiences and shaping future content decisions.
By adapting your content performance metrics, you can achieve a more accurate and nuanced understanding of its success across each platform.
Identifying Content Publication Platforms
Several online platforms are ideal for content publication. Three prominent examples include social media (e.g., Twitter, Instagram), dedicated content management systems (CMS) like WordPress, and email marketing platforms. Each platform offers a unique set of strengths, catering to specific content types and target audiences. Their varying characteristics influence how content is consumed and shared, affecting its visibility and engagement.
Applying Content Metrics to Different Platforms
The seven content metrics previously discussed can be adapted to evaluate performance across various platforms. The key is understanding the nuances of each platform’s user behavior and content consumption patterns. For example, social media metrics might focus on shares and retweets, while a CMS might track page views and time spent on site.
Platform-Specific Metric Adjustments
| Metric | Social Media (e.g., Twitter, Instagram) | Content Management System (e.g., WordPress) | Email Marketing | Platform Differences |
|---|---|---|---|---|
| Reach | Number of unique users who see the content | Number of visitors to the page | Number of recipients who open the email | Social media reach is often broader but less engaged than CMS or email. CMS focuses on website traffic. Email focuses on conversions from opens. |
| Engagement | Number of likes, comments, shares, and retweets | Time spent on the page, bounce rate, and click-through rates | Click-through rates to links in the email, open rates, and reply rates | Engagement on social media is typically measured by interactions. CMS engagement measures user behavior on the page. Email engagement measures how recipients interact with the content. |
| Conversion Rate | Number of users who take a desired action (e.g., visit a website, sign up for a newsletter) | Number of visitors who complete a desired action (e.g., make a purchase, download a resource) | Number of recipients who complete a desired action (e.g., make a purchase, request a demo) | Conversion rates are different for each platform, depending on the platform’s purpose. Social media conversions are often indirect. CMS conversions focus on website actions. Email conversions target specific actions like purchases. |
| Content Authority | Number of influencers who share the content and mentions of the content | Backlinks from other reputable sites and domain authority scores | Content authority is less applicable in email marketing. | Social media authority depends on influencers. CMS authority is based on backlinks and domain score. Email authority isn’t a direct metric. |
Content Performance Over Time
Tracking content performance isn’t a one-time snapshot; it’s a continuous journey. Understanding how your content performs over time is crucial for optimizing your strategy and maximizing its impact. Consistent monitoring reveals trends, allowing you to identify what’s working and what needs adjustments. This insight is essential for long-term content success.
Tracking Metrics Over Time
Regular monitoring of your content metrics is essential to understand the effectiveness of your strategies. Tracking these metrics over time, whether weekly, monthly, or quarterly, allows you to identify patterns and make data-driven decisions. By observing the trends in your chosen metrics, you can pinpoint areas where your content is performing exceptionally well and where improvements are needed.
Time-Based Metric Analysis, 7 important metrics track contents success
To effectively analyze the performance of your content over time, a structured approach is recommended. The table below illustrates a 3-month trend analysis for seven key metrics. This sample demonstrates how to track these metrics on a weekly, monthly, and quarterly basis, providing a comprehensive view of your content’s performance.
| Date | Website Traffic | Engagement Rate | Social Shares | Lead Generation | Conversion Rate | Bounce Rate | Average Session Duration |
|---|---|---|---|---|---|---|---|
| Week 1, Month 1 | 10,000 | 5% | 200 | 20 | 2% | 40% | 2 minutes |
| Week 2, Month 1 | 12,000 | 6% | 250 | 25 | 2.5% | 38% | 2.5 minutes |
| Week 3, Month 1 | 11,500 | 5.5% | 220 | 22 | 2.2% | 42% | 2 minutes |
| Week 4, Month 1 | 13,000 | 7% | 280 | 28 | 2.8% | 35% | 2.8 minutes |
| Month 2 | 15,000 | 8% | 300 | 30 | 3% | 32% | 3 minutes |
| Month 3 | 17,000 | 9% | 350 | 35 | 3.5% | 28% | 3.5 minutes |
Analyzing Trend Patterns
Examining the trend patterns in the metrics provides insights into the effectiveness of your content strategies. A consistent upward trend in website traffic, engagement, and conversions suggests a positive impact. Conversely, a downward trend in these areas may signal the need for adjustments to your content strategy.
Metric Comparison Over Time
A crucial step in understanding the effectiveness of your content is comparing the metrics across different time periods. This comparison helps you identify trends, seasonality, and the impact of any changes in your content strategy or marketing campaigns. The table below showcases a comparative analysis.
| Metric | Month 1 | Month 2 | Month 3 | Difference |
|---|---|---|---|---|
| Website Traffic | 12,000 | 15,000 | 17,000 | +4,000 (33%) |
| Engagement Rate | 6% | 8% | 9% | +3% |
| Social Shares | 250 | 300 | 350 | +100 (40%) |
Content Engagement and User Interaction: 7 Important Metrics Track Contents Success
Understanding how users interact with your content is crucial for assessing its effectiveness. Engagement metrics reveal not just how many people see your content, but also how deeply they interact with it, providing invaluable insights into its value and resonance. This section dives into key indicators of user engagement and their significance in evaluating content success.Engagement metrics aren’t just about vanity numbers; they offer a window into user experience.
By analyzing these metrics, we can pinpoint what resonates with our audience and tailor our content strategy accordingly. This proactive approach ensures our content effectively connects with the target audience, driving desired actions and outcomes.
Key Indicators of User Engagement
Engagement indicators go beyond simple page views. They reveal the depth of user interaction and the content’s perceived value. Three key indicators are crucial for understanding how users engage with content:
- Time on Page: This metric tracks the average duration users spend on a specific piece of content. A longer time spent typically indicates that the content is valuable and engaging, keeping the user interested.
- Bounce Rate: The bounce rate measures the percentage of visitors who leave the page after viewing only one page. A low bounce rate suggests that the content is compelling enough to encourage further exploration.
- Click-Through Rate (CTR): This measures the percentage of users who click on a specific link or call-to-action within the content. A high CTR indicates that the content is relevant and motivating users to take desired actions.
Significance of Engagement Indicators
These engagement indicators provide a multifaceted view of content effectiveness. A high time on page, combined with a low bounce rate and high CTR, strongly suggests that the content is resonating with the target audience. Conversely, low engagement indicators can highlight areas needing improvement in the content’s design, structure, or relevance.For instance, a high bounce rate could indicate that the page’s introduction or headline isn’t capturing user interest.
Analyzing the engagement indicators allows for a nuanced understanding of user behavior and informs adjustments to improve the content’s appeal and effectiveness.
Improving User Engagement
Understanding the significance of engagement indicators allows for targeted improvements. Analyzing patterns in user behavior (time spent, clicks, etc.) can reveal specific content elements that are driving engagement or deterring it. Based on this analysis, strategies can be implemented to enhance engagement:
- Optimize Content Structure: Breaking down large blocks of text into smaller, digestible chunks can improve user experience and increase time on page. Using visuals like images, videos, or infographics can also enhance engagement.
- Improve Clarity and Relevance: Ensure that the content directly addresses the user’s needs and expectations. A clear, concise, and relevant message will maintain user interest.
- Strategic Call-to-Actions (CTAs): Well-placed and compelling CTAs can guide users towards desired actions, increasing CTR and overall engagement.
Correlation Between Metrics and User Engagement
The table below illustrates the correlation between the seven content success metrics and user engagement. This provides a comprehensive view of how different metrics interact to influence user engagement.
| Metric | Time on Page | Bounce Rate | CTR | Engagement Level |
|---|---|---|---|---|
| Content Performance Across Platforms | High | Low | Medium | High |
| Content Performance Over Time | High | Low | High | High |
| Defining Content Success Metrics | Medium | Medium | Low | Medium |
| Content Reach and Visibility | Medium | Medium | Medium | Medium |
| Content Quality and Value | High | Low | High | High |
| Content Engagement and User Interaction | High | Low | High | High |
| Content Distribution and Promotion | Medium | Medium | Medium | Medium |
Content Success in Different Industries
Content success isn’t a one-size-fits-all metric. The relevance and weighting of key performance indicators (KPIs) vary significantly depending on the industry. Understanding these nuances is crucial for creating effective content strategies tailored to specific market needs and expectations. A successful content strategy for a tech startup will differ from one for a financial institution, and the same metrics will have different applications.Different industries have varying content needs and goals.
Tracking content success hinges on key metrics like engagement, traffic, and conversions. Knowing if your SEO firm is actually driving results is crucial. Is your SEO firm is helping you achieve these goals? Ultimately, understanding these metrics—bounce rate, time on site, and keyword rankings—gives a clear picture of how well your content performs.
An e-commerce site might prioritize driving sales conversions, while a technology company might focus on thought leadership and brand awareness. These varying priorities influence how content metrics are interpreted and implemented. The effectiveness of a content strategy relies on adapting to the particular nuances of each industry.
Relevance of Metrics Across Industries
Different industries place varying emphasis on content metrics. For instance, in e-commerce, metrics like conversion rates and click-through rates are paramount, while in technology, brand mentions and social media engagement often carry more weight. Financial institutions, on the other hand, may emphasize content’s role in building trust and demonstrating expertise. Understanding these industry-specific priorities is key to effectively leveraging content for success.
Metric Adjustments and Weighting
The weighting of metrics should be adjusted based on industry specifics. For example, in e-commerce, conversion rates might be weighted higher than in the technology sector, where thought leadership and brand building take precedence. Similarly, in the financial sector, the impact of content on building trust and fostering client relationships is of significant importance, thus requiring a different weighting compared to e-commerce.
Adapting metrics is vital for creating a successful content strategy tailored to specific industry requirements.
Applications of Metrics in Specific Industries
Let’s explore how these metrics can be applied in various industries. In e-commerce, high click-through rates from content to product pages indicate strong engagement and likely conversion potential. In technology, high social media shares and mentions demonstrate a strong impact on brand awareness and influence. Finance content should prioritize building credibility and trust through well-researched, expert-backed information. These applications highlight the importance of industry-specific content strategy.
Industry-Specific Metric Application
| Metric | E-commerce | Technology | Finance |
|---|---|---|---|
| Content Performance Across Platforms | Analyze click-through rates from social media to product pages. | Track the reach and engagement on industry-specific platforms. | Monitor the effectiveness of content in generating leads for financial services. |
| Content Performance Over Time | Observe trends in conversion rates over seasonal cycles. | Track how user engagement evolves with new product launches. | Analyze how investor sentiment changes in response to market updates. |
| Content Engagement and User Interaction | Measure the bounce rate of articles leading to product pages. | Monitor the number of comments and questions related to technical articles. | Assess the depth of client engagement with educational resources. |
| Defining Content Success Metrics | Set conversion rates as a primary success metric. | Prioritize brand mentions and thought leadership. | Establish metrics aligned with building trust and investor confidence. |
| Content Reach and Visibility | Focus on driving traffic to product pages. | Aim for broad reach across industry-specific communities. | Target specific investor demographics and publications. |
| Content Authority and Expertise | Showcase product knowledge through articles. | Demonstrate technical expertise through insightful content. | Build credibility by highlighting industry knowledge and experience. |
| Content Conversion Rates | Focus on the percentage of visitors converting to paying customers. | Focus on generating leads and downloads for software and services. | Focus on client engagement and positive financial outcomes. |
Content Strategy and Metric Alignment
A successful content strategy isn’t just about creating great content; it’s about understanding how that content performs and adapting to achieve business goals. This crucial step involves aligning content creation with measurable metrics, enabling continuous improvement and optimization. Effective strategies are built on data-driven insights, ensuring content resonates with the target audience and drives desired outcomes.Understanding the performance of content through metrics allows for strategic adjustments and proactive improvement.
By analyzing key metrics, businesses can identify what resonates with their audience, what needs refinement, and where to allocate resources effectively for future content creation. This data-driven approach ensures the content strategy remains agile and impactful.

Adjusting Content Strategies Based on Metric Performance
Analyzing content performance metrics reveals valuable insights that inform strategic adjustments. For example, if engagement metrics (e.g., comments, shares, time on page) are low for a particular content type, the strategy might involve adjusting the tone, style, or format of future content in that category. Perhaps a more visually engaging approach or a more interactive format will yield better results.
Alternatively, if website traffic metrics (e.g., unique visitors, bounce rate) are high for a specific topic, the content strategy could benefit from producing more content related to that subject area.
Influencing Future Content Creation Using Metric Analysis
Content creation should not be a random process. Insights from metric analysis empower businesses to tailor future content strategies more effectively. If a specific topic consistently performs well across multiple platforms, investing in more content related to that topic is justified. Conversely, if a particular content format performs poorly across different platforms, it’s crucial to adjust the content creation strategy to focus on alternative formats that resonate better with the target audience.
For instance, if videos consistently generate high engagement but blog posts perform poorly, the strategy might shift towards creating more video content.
Prioritizing Content Improvement Based on Metric Analysis
Content improvement isn’t a one-size-fits-all approach. Metric analysis allows for targeted improvement. If a specific piece of content underperforms on key metrics, analyzing why it failed can offer valuable lessons. Is it the topic, the writing style, the visuals, or something else? The insights can help pinpoint the specific areas needing improvement.
Prioritizing content improvement is about identifying content that is not performing as expected, and then implementing changes to improve the content’s performance. For example, if a blog post about a specific product has low click-through rates, the strategy might involve updating the product description, adding more high-quality images, or incorporating a compelling call to action.
Aligning Content Strategy with Business Goals
The ultimate goal of any content strategy is to support business objectives. Metrics serve as critical benchmarks to assess whether the strategy is effectively contributing to these goals. If a business objective is to increase brand awareness, metrics like social media shares, website traffic, and mentions in relevant publications can be used to gauge the success of the content strategy in achieving this goal.
If a business objective is to drive sales, then metrics like click-through rates, conversion rates, and revenue generated from content-driven campaigns will indicate how effectively the content strategy is achieving this. Content performance metrics directly link to business goals, enabling businesses to monitor progress and adjust the strategy as needed.
Tracking content success hinges on key metrics like engagement, reach, and conversions. To truly understand what resonates with your audience, though, you need to ask the right questions. Tools like those found in survey questions that work can help you craft effective surveys to measure audience response and identify areas for improvement. Ultimately, these insights will refine your content strategy and make those metrics even more telling about your overall success.
Content Promotion and Metric Impact
Content promotion isn’t just about getting your content seen; it’s about strategically driving engagement and achieving tangible results. Effective promotion strategies directly influence how your content performs across various platforms and over time, impacting metrics like reach, engagement, and conversions. Understanding the interplay between promotion tactics and metric performance is crucial for maximizing the return on your content investment.A well-defined promotion strategy allows you to target the right audience and tailor your approach to specific content types.
By understanding which methods resonate best with different content formats, you can optimize your promotion efforts and achieve better results. Tracking the impact of these strategies on key metrics provides valuable insights for continuous improvement and refinement of your content marketing efforts.
Different Promotion Methods and Their Impact on Metrics
Understanding how different promotion methods affect various metrics is crucial for optimizing your strategy. Promotion methods can be categorized into several groups, each impacting metrics in unique ways.
- Social Media Promotion: Platforms like Twitter, Facebook, and Instagram offer diverse tools for content promotion. Targeted ads on these platforms can significantly boost reach and engagement, directly impacting the number of impressions and clicks on the content. Sharing content organically through posts and interactions with influencers can increase visibility and brand awareness, influencing metrics like brand mentions and social shares.
This often translates to improved engagement and potentially increased traffic to your website.
- Email Marketing: Targeted email campaigns can directly drive traffic to specific content pieces. Segmentation and personalization of email content can lead to higher open rates and click-through rates, which impact metrics like website traffic and lead generation. The content shared in emails should be relevant to the recipient to ensure higher engagement.
- Paid Advertising: Paid advertising campaigns, particularly on search engines and social media, allow for highly targeted content promotion. Effective use of s and compelling ad copy can result in higher click-through rates and conversion rates, impacting website traffic and lead generation. Analyzing the cost per click and return on ad spend (ROAS) is vital for measuring the effectiveness of paid advertising.
- Influencer Marketing: Collaborating with influencers can amplify your content’s reach and credibility. Influencers with a strong following in your target audience can generate significant impressions and engagement, potentially impacting metrics like brand awareness, social shares, and website traffic. Selecting influencers whose values align with your brand is key to maintaining credibility and maximizing impact.
- Public Relations and Outreach: Press releases, media outreach, and partnerships with relevant publications can increase brand visibility and drive traffic to your content. This can significantly impact brand mentions and media coverage, leading to improved brand awareness and website traffic. Careful selection of publications and a well-crafted press release are crucial for success.
Relationship Between Promotion Strategies and Metric Performance
The success of your promotion strategy directly correlates with the performance of your chosen metrics. A well-structured promotion strategy, targeting the right audience and utilizing effective methods, will positively influence key metrics. Conversely, a poorly planned strategy can lead to decreased performance across various metrics. This relationship is dynamic and requires ongoing analysis and adaptation to maximize effectiveness.
Tracking Promotion Impact on Chosen Metrics
Tracking the impact of your promotion efforts is crucial for evaluating success and making necessary adjustments. Tools and methods for tracking include:
- Website Analytics (e.g., Google Analytics): Track website traffic sources, bounce rates, and engagement metrics to understand how different promotion channels drive traffic and engagement.
- Social Media Analytics: Monitor social media engagement metrics, such as likes, shares, comments, and reach, to understand the impact of your promotion efforts on different platforms.
- Email Marketing Metrics: Analyze open rates, click-through rates, and conversions to gauge the effectiveness of your email campaigns in driving engagement and conversions.
- Paid Advertising Analytics: Monitor click-through rates, conversion rates, and return on ad spend to evaluate the effectiveness of your paid advertising campaigns.
- Influencer Marketing Tracking: Track impressions, reach, engagement, and website traffic to gauge the effectiveness of influencer collaborations.
Effective Promotion Methods for Specific Content Types
The optimal promotion methods vary based on the content type. For example, visually engaging content like infographics and videos might benefit more from social media promotion and influencer marketing, while in-depth articles might perform better through email marketing and paid advertising.
Final Thoughts
In conclusion, understanding and tracking these 7 key metrics is crucial for optimizing your content strategy. By consistently monitoring performance, adapting to platform-specific nuances, and aligning your efforts with industry benchmarks, you can significantly improve the impact of your content. This detailed exploration of metrics, platforms, and time trends empowers you to make data-driven decisions and ultimately achieve greater success in your content marketing endeavors.